Hamilton Centre (federal electoral district)
Hamilton Centre (French: Hamilton-Centre) is a federal electoral district in Hamilton, Ontario, Canada, that has been represented in the House of Commons of Canada since 2004.
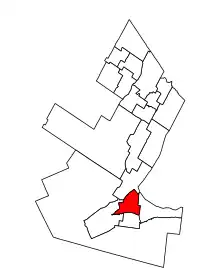 Hamilton Centre in relation to the other Hamilton area ridings (2003 boundaries) | |||
| Federal electoral district | |||
| Legislature | House of Commons | ||
| MP |
New Democratic | ||
| District created | 2003 | ||
| First contested | 2004 | ||
| Last contested | 2021 | ||
| District webpage | profile, map | ||
| Demographics | |||
| Population (2011)[1] | 101,932 | ||
| Electors (2015) | 68,247 | ||
| Area (km²)[1] | 32 | ||
| Pop. density (per km²) | 3,185.4 | ||
| Census division(s) | Hamilton | ||
| Census subdivision(s) | Hamilton | ||
History
It was created in 2003 from parts of Hamilton East, Hamilton West and Ancaster—Dundas—Flamborough—Aldershot ridings.
This riding lost territory to Hamilton West—Ancaster—Dundas and gained territory from Hamilton East—Stoney Creek during the 2012 electoral redistribution.
Geography
Consisting of that part of the City of Hamilton described as follows: commencing at the intersection of James Mountain Road with the Niagara Escarpment; thence generally westerly along said escarpment to the electric power transmission line situated westerly of Chateau Court; thence northerly along said transmission line to Highway No. 403; thence generally northeasterly along said highway to the Desjardins Canal; thence easterly along said canal and continuing due east in Hamilton Harbour to the northerly production of Queen Street North; thence northerly in a straight line along said production to the northerly limit of said city; thence generally northeasterly, southeasterly and northeasterly along said limit to the northerly production of Ottawa Street North; thence southerly along said production and Ottawa Street North to Burlington Street East; thence easterly along said street to Kenilworth Avenue North; thence southerly along said avenue and Kenilworth Avenue South to Lawrence Road; thence westerly along said road to the southerly production of Keswick Court; thence southerly along said production to the Niagara Escarpment; thence generally westerly along said escarpment to the point of commencement.
Demographics
- According to the 2021 Canadian census[2]
Languages: 77.2% English, 2.2% Spanish, 2.1% French, 2.1% Portuguese, 2.0% Arabic, 1.1% Vietnamese, 1.0% Italian
Religions: 43.9% Christian (21.8% Catholic, 3.4% Anglican, 2.1% United Church, 1.4% Christian Orthodox, 1.4% Presbyterian, 1.2% Baptist, 1.0% Pentecostal, 11.5% other Christian), 6.2% Muslim, 2.0% Hindu, 1.5% Buddhist, 44.2% none
Median income: $35,200 (2020)
Average income: $44,560 (2020)
| Panethnic group | 2021[3] | 2016[4] | 2011[5] | |||||||||||
|---|---|---|---|---|---|---|---|---|---|---|---|---|---|---|
| Pop. | % | Pop. | % | Pop. | % | |||||||||
| European[lower-alpha 1] | 72,070 | 69.48% | 71,730 | 73.82% | 75,985 | 77.65% | ||||||||
| African | 8,380 | 8.08% | 6,390 | 6.58% | 4,935 | 5.04% | ||||||||
| Southeast Asian[lower-alpha 2] | 4,585 | 4.42% | 3,675 | 3.78% | 3,955 | 4.04% | ||||||||
| South Asian | 4,420 | 4.26% | 2,600 | 2.68% | 1,985 | 2.03% | ||||||||
| Indigenous | 4,280 | 4.13% | 4,140 | 4.26% | 4,030 | 4.12% | ||||||||
| East Asian[lower-alpha 3] | 2,915 | 2.81% | 2,880 | 2.96% | 2,935 | 3% | ||||||||
| Middle Eastern[lower-alpha 4] | 2,810 | 2.71% | 2,260 | 2.33% | 1,280 | 1.31% | ||||||||
| Latin American | 2,440 | 2.35% | 2,105 | 2.17% | 2,050 | 2.09% | ||||||||
| Other/multiracial[lower-alpha 5] | 1,820 | 1.75% | 1,380 | 1.42% | 705 | 0.72% | ||||||||
| Total responses | 103,725 | 97.45% | 97,165 | 97.07% | 97,860 | 96.01% | ||||||||
| Total population | 106,439 | 100% | 100,103 | 100% | 101,932 | 100% | ||||||||
| Notes: Totals greater than 100% due to multiple origin responses. Demographics based on 2012 Canadian federal electoral redistribution riding boundaries. | ||||||||||||||
Members of Parliament
Hamilton Centre has been represented in the House of Commons of Canada by New Democrat Matthew Green since the 2019 federal election. Prior to that, the riding was held by David Christopherson, also of the NDP, from the 2004 federal election to 2019, after also holding the seat provincially from 1990 to 1999. The riding is considered an NDP "stronghold".[6]
| Parliament | Years | Member | Party | |
|---|---|---|---|---|
| Hamilton Centre Riding created from Hamilton East, Hamilton West and Ancaster—Dundas—Flamborough—Aldershot |
||||
| 38th | 2004–2006 | David Christopherson | New Democratic | |
| 39th | 2006–2008 | |||
| 40th | 2008–2011 | |||
| 41st | 2011–2015 | |||
| 42nd | 2015–2019 | |||
| 43rd | 2019–2021 | Matthew Green | ||
| 44th | 2021–present | |||
Election results
| 2021 Canadian federal election | ||||||||
|---|---|---|---|---|---|---|---|---|
| Party | Candidate | Votes | % | ±% | Expenditures | |||
| New Democratic | Matthew Green | 20,105 | 48.70 | +2.54 | $59,357.46 | |||
| Liberal | Margaret Bennett | 10,941 | 26.50 | -2.17 | $33,346.62 | |||
| Conservative | Fabian Grenning | 6,209 | 15.04 | +0.67 | none listed | |||
| People's | Kevin Barber | 2,637 | 6.39 | +4.50 | $0.00 | |||
| Green | Avra Caroline Weinstein | 1,105 | 2.68 | -4.96 | $3,627.12 | |||
| Communist | Nigel Cheriyan | 184 | 0.45 | – | $0.00 | |||
| Independent | Nathalie Xian Yi Yan | 99 | 0.24 | +0.05 | $0.00 | |||
| Total valid votes/expense limit | 41,280 | 99.16 | – | $120,288.26 | ||||
| Total rejected ballots | 351 | 0.84 | – | |||||
| Turnout | 41,631 | 55.72 | -3.36 | |||||
| Eligible voters | 74,721 | |||||||
| New Democratic hold | Swing | +2.35 | ||||||
| Source: Elections Canada[7][8] | ||||||||
| 2021 federal election redistributed results[9] | |||
|---|---|---|---|
| Party | Vote | % | |
| New Democratic | 23,390 | 46.96 | |
| Liberal | 13,315 | 26.73 | |
| Conservative | 8,227 | 16.52 | |
| People's | 3,271 | 6.57 | |
| Green | 1,325 | 2.66 | |
| Others | 283 | 0.57 | |
| 2019 Canadian federal election | ||||||||
|---|---|---|---|---|---|---|---|---|
| Party | Candidate | Votes | % | ±% | Expenditures | |||
| New Democratic | Matthew Green | 20,368 | 46.16 | +0.60 | $71,015.33 | |||
| Liberal | Jasper Kujavsky | 12,651 | 28.67 | -4.72 | $79,469.65 | |||
| Conservative | Monica Ciriello | 6,341 | 14.37 | -0.28 | $13,186.90 | |||
| Green | Jason Lopez | 3,370 | 7.64 | +3.31 | none listed | |||
| People's | Melina Mamone | 833 | 1.89 | – | none listed | |||
| Christian Heritage | Gary Duyzer | 182 | 0.41 | – | none listed | |||
| Independent | Tony Lemma | 158 | 0.36 | – | $2,716.24 | |||
| Independent | Edward Graydon | 134 | 0.30 | – | none listed | |||
| Independent | Nathalie Xian Yi Yan | 85 | 0.19 | – | none listed | |||
| Total valid votes/expense limit | 44,122 | 99.09 | ||||||
| Total rejected ballots | 405 | 0.91 | +0.26 | |||||
| Turnout | 44,527 | 59.08 | -0.34 | |||||
| Eligible voters | 75,371 | |||||||
| New Democratic hold | Swing | +2.66 | ||||||
| Source: Elections Canada[10][11] | ||||||||
| 2015 Canadian federal election | ||||||||
|---|---|---|---|---|---|---|---|---|
| Party | Candidate | Votes | % | ±% | Expenditures | |||
| New Democratic | David Christopherson | 18,719 | 45.56 | -14.69 | $52,665.42 | |||
| Liberal | Anne Tennier | 13,718 | 33.39 | +20.29 | $65,231.14 | |||
| Conservative | Yonatan Rozenszajn | 6,018 | 14.65 | -8.81 | $38,675.56 | |||
| Green | Ute Schmid-Jones | 1,778 | 4.33 | +3.83 | $5,331.63 | |||
| Marijuana | Michael James Baldasaro | 348 | 0.85 | – | – | |||
| Libertarian | Rob Young | 316 | 0.77 | – | $4,236.22 | |||
| Independent | Maria Anastasiou | 186 | 0.45 | – | $829.76 | |||
| Total valid votes/expense limit | 41,083 | 99.35 | $201,952.89 | |||||
| Total rejected ballots | 269 | 0.65 | ||||||
| Turnout | 41,352 | 59.42 | ||||||
| Eligible voters | 69,598 | |||||||
| New Democratic hold | Swing | -17.49 | ||||||
| Source: Elections Canada[12][13] | ||||||||
| 2011 federal election redistributed results[14] | |||
|---|---|---|---|
| Party | Vote | % | |
| New Democratic | 20,741 | 60.25 | |
| Conservative | 8,076 | 23.46 | |
| Liberal | 4,509 | 13.10 | |
| Others | 925 | 2.69 | |
| Green | 172 | 0.50 | |
| 2011 Canadian federal election | ||||||||
|---|---|---|---|---|---|---|---|---|
| Party | Candidate | Votes | % | ±% | Expenditures | |||
| New Democratic | David Christopherson | 23,849 | 57.0 | +7.7 | – | |||
| Conservative | James Byron | 11,020 | 26.4 | +4.1 | – | |||
| Liberal | Anne Tennier | 5,912 | 14.1 | -3.5 | – | |||
| Marijuana | Michael Baldasaro | 780 | 1.9 | n/a | – | |||
| Marxist–Leninist | Lisa Nussey | 252 | 0.6 | +0.3 | – | |||
| Total valid votes | 41,813 | 100.0 | – | |||||
| Total rejected ballots | 320 | 0.8 | – | |||||
| Turnout | 42,133 | 54.7 | – | |||||
| Eligible voters | 77,077 | – | ||||||
| 2008 Canadian federal election | ||||||||
|---|---|---|---|---|---|---|---|---|
| Party | Candidate | Votes | % | ±% | Expenditures | |||
| New Democratic | David Christopherson | 20,010 | 49.3 | -2.0 | $66,259 | |||
| Conservative | Leon O'Connor | 9,051 | 22.3 | +2.0 | $24,629 | |||
| Liberal | Helen Wilson | 7,164 | 17.6 | -5.9 | $30,226 | |||
| Green | John Livingstone | 3,625 | 8.9 | +4.2 | $5,353 | |||
| Libertarian | Anthony Giles | 528 | 1.3 | n/a | – | |||
| Marxist–Leninist | Lisa Nussey | 126 | 0.3 | n/a | ||||
| Communist | Ryan Sparrow | 125 | 0.3 | n/a | $373 | |||
| Total valid votes/expense limit | 39,850 | 100.0 | $85,900 | |||||
| 2006 Canadian federal election | ||||||||
|---|---|---|---|---|---|---|---|---|
| Party | Candidate | Votes | % | ±% | ||||
| New Democratic | David Christopherson | 24,503 | 51.3 | +5.5 | ||||
| Liberal | Javid Mirza | 11,224 | 23.5 | -10.2 | ||||
| Conservative | Elliot L. Hill | 9,969 | 20.3 | +5.7 | ||||
| Green | John Livingstone | 2,022 | 4.2 | +1.0 | ||||
| Canadian Action | Tony Des Lauriers | 332 | 0.7 | n/a | ||||
| Total valid votes | 47,777 | 100.0 | ||||||
| Total rejected ballots | 279 | |||||||
| Turnout | 48,056 | 59.2 | ||||||
| 2004 Canadian federal election | ||||||||
|---|---|---|---|---|---|---|---|---|
| Party | Candidate | Votes | % | |||||
| New Democratic | David Christopherson | 20,321 | 45.8 | |||||
| Liberal | Stan Keyes | 14,948 | 33.7 | |||||
| Conservative | Leon O'Connor | 6,714 | 15.1 | |||||
| Green | Anne Marie Pavlov | 1,422 | 3.2 | |||||
| Christian Heritage | Stephen Downey | 520 | 1.2 | |||||
| Independent | Michael James Baldasaro | 345 | 0.8 | |||||
| Marxist–Leninist | Jamile Ghaddar | 91 | 0.2 | |||||
| Total valid votes | 44,361 | 100.0 | ||||||
See also
References
- "Hamilton Centre (federal electoral district) (Code 35031) Census Profile". 2011 census. Government of Canada - Statistics Canada. Retrieved 3 March 2011.
- Riding history from the Library of Parliament
- Campaign expense data from Elections Canada
Notes
- Statistic includes all persons that did not make up part of a visible minority or an indigenous identity.
- Statistic includes total responses of "Filipino" and "Southeast Asian" under visible minority section on census.
- Statistic includes total responses of "Chinese", "Korean", and "Japanese" under visible minority section on census.
- Statistic includes total responses of "West Asian" and "Arab" under visible minority section on census.
- Statistic includes total responses of "Visible minority, n.i.e." and "Multiple visible minorities" under visible minority section on census.
- Statistics Canada: 2011
- "Census Profile, 2021 Census of Population Profile table". 6 December 2022.
- Government of Canada, Statistics Canada (26 October 2022). "Census Profile, 2021 Census of Population". www12.statcan.gc.ca. Retrieved 7 April 2024.
- Government of Canada, Statistics Canada (27 October 2021). "Census Profile, 2016 Census". www12.statcan.gc.ca. Retrieved 7 April 2024.
- Government of Canada, Statistics Canada (27 November 2015). "NHS Profile". www12.statcan.gc.ca. Retrieved 7 April 2024.
- Mowat, Justin (14 October 2019). "Trudeau rallies support in NDP stronghold riding of Hamilton Centre". CBC Hamilton.
- "List of confirmed candidates – September 20, 2021 Federal Election". Elections Canada. Retrieved 2 September 2021.
- "Official Voting Results". Elections Canada. Retrieved 21 April 2024.
- "Transposition of Votes from the 44th General Election to the 2023 Representation Orders". Elections Canada. Retrieved 9 April 2024.
- "List of confirmed candidates". Elections Canada. Retrieved 4 October 2019.
- "Official Voting Results". Elections Canada. Retrieved 14 August 2021.
- Elections Canada – Confirmed candidates for Hamilton Centre, 30 September 2015
- Elections Canada – Preliminary Election Expenses Limits for Candidates
- Pundits' Guide to Canadian Elections
Federal ridings in Hamilton, Halton and Niagara | ||
|---|---|---|
| Liberal |
| .png.webp) |
| Conservative |
| |
| New Democratic | ||