Kettering (UK Parliament constituency)
Kettering is a constituency[n 1] in Northamptonshire represented in the House of Commons of the UK Parliament since 2005 by Philip Hollobone, a Conservative.[n 2]
| Kettering | |
|---|---|
| County constituency for the House of Commons | |
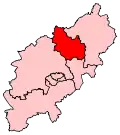 Boundary of Kettering in Northamptonshire | |
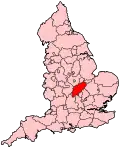 Location of Northamptonshire within England | |
| County | Northamptonshire |
| Electorate | 70,589 (2018)[1] |
| Major settlements | Kettering, Desborough, Burton Latimer and Rothwell |
| Current constituency | |
| Created | 1918 |
| Member of Parliament | Philip Hollobone (Conservative) |
| Seats | One |
| Created from | North Northamptonshire and Mid Northamptonshire |
Boundaries
1918–1950: The Urban Districts of Desborough, Kettering, and Rothwell, the Rural Districts of Brixworth, Kettering, and Oxendon, and in the Rural District of Northampton the parishes of Great Billing, Little Billing, and Weston Favell.
1950–1974: The Municipal Borough of Kettering, the Urban Districts of Burton Latimer, Corby, Desborough, and Rothwell, and the Rural Districts of Brixworth and Kettering.
1974–1983: The Municipal Borough of Kettering, the Urban Districts of Burton Latimer, Corby, Desborough, and Rothwell, and the Rural District of Kettering.
1983–1997: The Borough of Kettering, and the District of Daventry wards of Boughton and Pitsford, Brixworth, Clipston, Moulton, and Overstone and Walgrave.
1997–2010: The Borough of Kettering, and the District of Daventry wards of Boughton and Pitsford, Brixworth, Clipston, Guilsborough, Moulton, Overstone and Walgrave, Spratton, and Welford.
2010–2021: The Borough of Kettering.
2021–present: The North Northamptonshire Council wards of Burton and Broughton, Clover Hill, Desborough, Ise, Northall, Rothwell and Mawsley, Wicksteed, Windmill
The constituency covers the major town of Kettering, the smaller towns of Desborough, Rothwell and Burton Latimer together with a number of villages. A semi-rural seat, the preponderance of constituents live in the towns and a minority of the wards form a wide array of rural communities that have civil parish or hamlet status.
The constituency created in 1918 included the generally (in the late 20th century) Labour-majority industrial town of Corby until the 1983 general election, when Corby gained its own constituency.
The Boundary Commission's Fifth Periodic Review of Westminster constituencies proposed an additional seat due to population growth in the county. Parliament approved its recommendations for 2010 which made way for the new constituency of South Northamptonshire therefore the constituency lost some wards in these boundary changes.[n 3]
Proposed
Further to the 2023 Periodic Review of Westminster constituencies, enacted by the Parliamentary Constituencies Order 2023, the composition of the constituency from the next general election, due by January 2025, will be unchanged, except for the addition of polling districts CRWB, CRWC, CRWD, CRWE, CSCB and CSCC in the Corby Rural ward, transferred from the Corby constituency.[2]
Constituency profile
Economically, it is predominantly middle-class, well within managerial/directorial commuter zones for London and the West Midlands. Industry continues in some sectors ranging from, for example, lingerie,[3] food production, rigid containers, abattoirs, to the Weetabix factory in Burton Latimer, but the industrial activity of the area, as with the rest of the county, is reduced whereas the wider area's headline gross value added for the area per head has been mostly consistently higher, from £11,667 in 1997 in North Northamptonshire to £17,835.[n 4][4]
In 2005 The Guardian described it as:
'[A] mixed industrial town in Northamptonshire with good links to London.'
Members of Parliament
The current Member of Parliament is Philip Hollobone of the Conservative Party. He was elected in 2005 when he defeated the sitting Labour MP, Phil Sawford, in an election which nationally saw a reduced majority for the Blair Ministry.
Kettering Constituency (1918–present)
| Election | Member[5] | Party | |
|---|---|---|---|
| 1918 | Alfred Waterson | Co-operative | |
| 1922 | Owen Parker | Conservative | |
| 1923 | Samuel Perry | Labour Co-operative | |
| 1924 | Mervyn Manningham-Buller | Conservative | |
| 1929 | Samuel Perry | Labour Co-operative | |
| 1931 | John Eastwood | Conservative | |
| 1940 by-election | John Profumo | Conservative | |
| 1945 | Gilbert Mitchison | Labour | |
| 1964 | Geoffrey de Freitas | Labour | |
| 1979 | Bill Homewood | Labour | |
| 1983 | Roger Freeman | Conservative | |
| 1997 | Phil Sawford | Labour | |
| 2005 | Philip Hollobone | Conservative | |
Mid Northamptonshire Constituency (1885–1918)
Prior to boundary changes in 1918, at least the majority of modern-day Kettering Constituency laid within the Mid Northamptonshire constituency.
North Northamptonshire Constituency (1832–1885)
Prior to boundary changes in 1885, at least the majority of modern-day Kettering Constituency laid within the North Northamptonshire constituency, which elected two members to Parliament.
Elections
Elections in the 2020s
| Party | Candidate | Votes | % | ±% | |
|---|---|---|---|---|---|
| Conservative | Philip Hollobone[6] | ||||
| Reform UK | Daniel Monie[7] | ||||
| SDP | Matthew Murphy[8] | ||||
| Labour | Rosie Wrighting[9] | ||||
| Majority | |||||
| Turnout | |||||
Elections in the 2010s
| Party | Candidate | Votes | % | ±% | |
|---|---|---|---|---|---|
| Conservative | Philip Hollobone | 29,787 | 60.3 | ||
| Labour | Clare Pavitt | 13,022 | 26.4 | ||
| Liberal Democrats | Chris Nelson | 3,367 | 6.8 | ||
| Independent | Jim Hakewill | 1,642 | 3.3 | New | |
| Green | Jamie Wildman | 1,543 | 3.1 | ||
| Majority | 16,765 | 33.9 | |||
| Turnout | 49,361 | 67.4 | |||
| Conservative hold | Swing | ||||
| Party | Candidate | Votes | % | ±% | |
|---|---|---|---|---|---|
| Conservative | Philip Hollobone | 28,616 | 57.9 | ||
| Labour | Mick Scrimshaw | 18,054 | 36.5 | ||
| Liberal Democrats | Suzanna Austin | 1,618 | 3.3 | ||
| Green | Rob Reeves | 1,116 | 2.3 | ||
| Majority | 10,562 | 21.4 | |||
| Turnout | 49,404 | 69.1 | |||
| Conservative hold | Swing | ||||
| Party | Candidate | Votes | % | ±% | |
|---|---|---|---|---|---|
| Conservative | Philip Hollobone | 24,467 | 51.8 | +2.7 | |
| Labour | Rhea Keehn[12] | 11,877 | 25.2 | -4.7 | |
| UKIP | Jonathan Bullock[13] | 7,600 | 16.1 | New | |
| Green | Rob Reeves[14] | 1,633 | 3.5 | New | |
| Liberal Democrats | Chris McGlynn | 1,490 | 3.2 | -12.6 | |
| English Democrat | Derek Hilling[15] | 151 | 0.3 | -1.7 | |
| Majority | 12,590 | 26.6 | +7.4 | ||
| Turnout | 47,218 | 67.3 | -1.5 | ||
| Conservative hold | Swing | +3.75 | |||
| Party | Candidate | Votes | % | ±% | |
|---|---|---|---|---|---|
| Conservative | Philip Hollobone | 23,247 | 49.1 | +6.2 | |
| Labour | Phil Sawford | 14,153 | 29.9 | -12.7 | |
| Liberal Democrats | Chris Nelson | 7,498 | 15.8 | +3.6 | |
| BNP | Clive Skinner | 1,366 | 2.9 | New | |
| English Democrat | Derek Hilling | 952 | 2.0 | New | |
| Bus-Pass Elvis | Dave Bishop | 112 | 0.2 | New | |
| Majority | 9,094 | 19.2 | +13.2 | ||
| Turnout | 47,328 | 68.8 | -0.4 | ||
| Conservative hold | Swing | +9.4 | |||
Elections in the 2000s
| Party | Candidate | Votes | % | ±% | |
|---|---|---|---|---|---|
| Conservative | Philip Hollobone | 25,401 | 45.6 | +2.1 | |
| Labour | Phil Sawford | 22,100 | 39.7 | -5.0 | |
| Liberal Democrats | Roger Aron | 6,882 | 12.4 | +2.2 | |
| UKIP | Rosemarie Clarke | 1,263 | 2.3 | +0.6 | |
| Majority | 3,301 | 5.9 | N/A | ||
| Turnout | 55,646 | 68.0 | -0.1 | ||
| Conservative gain from Labour | Swing | +3.55 | |||
| Party | Candidate | Votes | % | ±% | |
|---|---|---|---|---|---|
| Labour | Phil Sawford | 24,034 | 44.7 | +1.4 | |
| Conservative | Philip Hollobone | 23,369 | 43.5 | +0.5 | |
| Liberal Democrats | Roger Aron | 5,469 | 10.2 | -0.5 | |
| UKIP | Barry Mahoney | 880 | 1.6 | New | |
| Majority | 665 | 1.2 | +0.9 | ||
| Turnout | 53,752 | 68.1 | -7.4 | ||
| Labour hold | Swing | +0.45 | |||
Elections in the 1990s
| Party | Candidate | Votes | % | ±% | |
|---|---|---|---|---|---|
| Labour | Phil Sawford | 24,650 | 43.3 | +11.4 | |
| Conservative | Roger Freeman | 24,461 | 43.0 | −9.8 | |
| Liberal Democrats | Roger Aron | 6,098 | 10.7 | −4.7 | |
| Referendum | Arthur E. Smith | 1551 | 2.7 | New | |
| Natural Law | Rosemary le Carpentier | 197 | 0.3 | New | |
| Majority | 189 | 0.3 | N/A | ||
| Turnout | 56,957 | 75.5 | −7.4 | ||
| Labour gain from Conservative | Swing | +9.9 | |||
| Party | Candidate | Votes | % | ±% | |
|---|---|---|---|---|---|
| Conservative | Roger Freeman | 29,115 | 52.0 | +0.9 | |
| Labour Co-op | Phil Hope | 17,961 | 32.1 | +12.4 | |
| Liberal Democrats | Richard D. Denton-White | 8,962 | 16.0 | −13.3 | |
| Majority | 11,154 | 19.9 | −1.8 | ||
| Turnout | 56,038 | 82.6 | +3.8 | ||
| Conservative hold | Swing | −5.7 | |||
Elections in the 1980s
| Party | Candidate | Votes | % | ±% | |
|---|---|---|---|---|---|
| Conservative | Roger Freeman | 26,532 | 51.0 | +2.6 | |
| SDP | Celia Goodhart | 15,205 | 29.3 | −1.2 | |
| Labour | Ashley M. Minto | 10,229 | 19.7 | −1.4 | |
| Majority | 11,327 | 21.7 | +3.8 | ||
| Turnout | 51,196 | 78.8 | +2.4 | ||
| Conservative hold | Swing | ||||
| Party | Candidate | Votes | % | ±% | |
|---|---|---|---|---|---|
| Conservative | Roger Freeman | 23,223 | 48.4 | -0.2 | |
| SDP | Celia Goodhart | 14,637 | 30.5 | +18.4 | |
| Labour | Alex Gordon | 10,119 | 21.1 | -18.3 | |
| Majority | 8,586 | 17.9 | N/A | ||
| Turnout | 47,979 | 76.4 | -2.9 | ||
| Conservative gain from Labour | Swing | +14.7 | |||
Note: The boundary changes to the seat for the 1983 election meant that this seat would have been won by the Conservatives in 1979, as parts of the seat were moved into the newly created seat of Corby which was notionally Labour on the new boundaries and thus saw William Homewood attempt (unsuccessfully albeit) to seek re-election there.
Elections in the 1970s
| Party | Candidate | Votes | % | ±% | |
|---|---|---|---|---|---|
| Labour | William Homewood | 31,579 | 45.0 | -4.3 | |
| Conservative | Rupert Allason | 30,101 | 42.9 | +11.4 | |
| Liberal | G. Raven | 8,424 | 12.0 | -7.2 | |
| Majority | 1,478 | 2.1 | -15.7 | ||
| Turnout | 70,104 | 79.3 | +6.1 | ||
| Labour hold | Swing | ||||
| Party | Candidate | Votes | % | ±% | |
|---|---|---|---|---|---|
| Labour | Geoffrey de Freitas | 30,970 | 49.3 | +3.4 | |
| Conservative | G.D. Reed | 19,800 | 31.5 | -0.2 | |
| Liberal | A. James W. Haigh | 12,038 | 19.2 | -3.1 | |
| Majority | 11,170 | 17.8 | +3.6 | ||
| Turnout | 62,808 | 73.2 | -7.9 | ||
| Labour hold | Swing | ||||
| Party | Candidate | Votes | % | ±% | |
|---|---|---|---|---|---|
| Labour | Geoffrey de Freitas | 31,659 | 45.9 | -2.3 | |
| Conservative | G.D. Reed | 21,872 | 31.7 | -10.7 | |
| Liberal | A. James W. Haigh | 15,393 | 22.3 | +13.0 | |
| Majority | 9,787 | 14.2 | +8.4 | ||
| Turnout | 68,924 | 81.1 | +5.6 | ||
| Labour hold | Swing | ||||
| Party | Candidate | Votes | % | ±% | |
|---|---|---|---|---|---|
| Labour | Geoffrey de Freitas | 34,803 | 48.3 | -4.3 | |
| Conservative | John Charles Taylor | 30,613 | 42.5 | +6.9 | |
| Liberal | A. James W. Haigh | 6,695 | 9.3 | -2.5 | |
| Majority | 4,190 | 5.8 | -11.2 | ||
| Turnout | 72,111 | 75.5 | -5.8 | ||
| Labour hold | Swing | ||||
Elections in the 1960s
| Party | Candidate | Votes | % | ±% | |
|---|---|---|---|---|---|
| Labour | Geoffrey de Freitas | 35,337 | 52.6 | -2.6 | |
| Conservative | Trevor E.T. Weston | 23,877 | 35.6 | -9.2 | |
| Liberal | Anthony Smith | 7,903 | 11.8 | New | |
| Majority | 11,460 | 17.0 | +6.6 | ||
| Turnout | 67,117 | 81.3 | -0.2 | ||
| Labour hold | Swing | ||||
| Party | Candidate | Votes | % | ±% | |
|---|---|---|---|---|---|
| Labour | Geoffrey de Freitas | 36,210 | 55.2 | +2.4 | |
| Conservative | J. Hedley Lewis | 29,405 | 44.8 | -2.4 | |
| Majority | 6,805 | 10.4 | +2.4 | ||
| Turnout | 65,615 | 81.5 | +4.0 | ||
| Labour hold | Swing | ||||
Elections in the 1950s
| Party | Candidate | Votes | % | ±% | |
|---|---|---|---|---|---|
| Labour | Dick Mitchison | 32,933 | 52.8 | -2.4 | |
| Conservative | Neil Stone | 29,448 | 47.2 | 2.4 | |
| Majority | 3,485 | 5.6 | -4.8 | ||
| Turnout | 62,381 | 77.5 | -4.1 | ||
| Labour hold | Swing | ||||
| Party | Candidate | Votes | % | ±% | |
|---|---|---|---|---|---|
| Labour | Dick Mitchison | 31,198 | 55.2 | -0.6 | |
| Conservative | John F. Nash | 25,495 | 44.8 | +0.6 | |
| Majority | 5,903 | 10.4 | -1.2 | ||
| Turnout | 56,893 | 81.6 | -5.6 | ||
| Labour hold | Swing | ||||
| Party | Candidate | Votes | % | ±% | |
|---|---|---|---|---|---|
| Labour | Dick Mitchison | 32,604 | 55.8 | +3.2 | |
| Conservative | C. Peter B. Bailey | 25,777 | 44.2 | +5.6 | |
| Majority | 6,827 | 11.6 | -2.4 | ||
| Turnout | 58,381 | 87.2 | -0.9 | ||
| Labour hold | Swing | ||||
| Party | Candidate | Votes | % | ±% | |
|---|---|---|---|---|---|
| Labour | Dick Mitchison | 30,243 | 52.6 | -1.0 | |
| Conservative | Gyles Isham | 22,169 | 38.6 | -3.5 | |
| Liberal | Ian Morrow | 4,692 | 8.2 | New | |
| Communist | L.P. O'Connor | 368 | 0.6 | New | |
| Majority | 8,074 | 14.0 | +2.5 | ||
| Turnout | 57,472 | 88.1 | +13.0 | ||
| Labour hold | Swing | ||||
Elections in the 1940s
| Party | Candidate | Votes | % | ±% | |
|---|---|---|---|---|---|
| Labour | Dick Mitchison | 29,868 | 53.6 | +5.7 | |
| Conservative | John Profumo | 23,424 | 42.1 | -10.0 | |
| Christian Pacifist Party | John Chamberlain Dempsey | 2,381 | 4.3 | New | |
| Majority | 6,444 | 11.5 | N/A | ||
| Turnout | 24,530 | 75.1 | -2.2 | ||
| Labour gain from Conservative | Swing | ||||
The British Council commissioned a short film on the 1945 General Election which portrays the contest in the Kettering constituency.[24]
| Party | Candidate | Votes | % | ±% | |
|---|---|---|---|---|---|
| Conservative | John Profumo | 17,914 | 73.0 | +20.9 | |
| Workers' and Pensioners' Anti-War | W. Ross | 6,616 | 27.0 | New | |
| Majority | 11,298 | 46.0 | +41.8 | ||
| Turnout | 24,530 | 37.8 | −39.5 | ||
| Conservative hold | Swing | ||||
Elections in the 1930s
| Party | Candidate | Votes | % | ±% | |
|---|---|---|---|---|---|
| Conservative | John Eastwood | 22,885 | 52.1 | -8.1 | |
| Labour Co-op | J.R. Sadler | 21,042 | 47.9 | +8.1 | |
| Majority | 1,843 | 4.2 | -16.1 | ||
| Turnout | 43,927 | 77.3 | -8.4 | ||
| Conservative hold | Swing | ||||
| Party | Candidate | Votes | % | ±% | |
|---|---|---|---|---|---|
| Conservative | John Eastwood | 25,811 | 60.2 | +23.1 | |
| Labour Co-op | Samuel Perry | 17,095 | 39.8 | -4.0 | |
| Majority | 8,716 | 20.3 | N/A | ||
| Turnout | 42,906 | 85.7 | -0.1 | ||
| Conservative gain from Labour | Swing | ||||
Elections in the 1920s
| Party | Candidate | Votes | % | ±% | |
|---|---|---|---|---|---|
| Labour Co-op | Samuel Perry | 18,253 | 43.8 | −4.2 | |
| Unionist | J. Brown | 15,469 | 37.1 | −14.9 | |
| Liberal | Cuthbert Snowball Rewcastle | 7,972 | 19.1 | New | |
| Majority | 2,784 | 6.7 | N/A | ||
| Turnout | 23,441 | 85.8 | +1.5 | ||
| Registered electors | 48,588 | ||||
| Labour Co-op gain from Unionist | Swing | +5.4 | |||
| Party | Candidate | Votes | % | ±% | |
|---|---|---|---|---|---|
| Unionist | Mervyn Manningham-Buller | 16,042 | 52.0 | +17.0 | |
| Labour Co-op | Samuel Perry | 14,801 | 48.0 | +4.5 | |
| Majority | 1,241 | 4.0 | N/A | ||
| Turnout | 30,843 | 84.3 | +3.0 | ||
| Registered electors | 36,574 | ||||
| Unionist gain from Labour Co-op | Swing | +6.3 | |||
| Party | Candidate | Votes | % | ±% | |
|---|---|---|---|---|---|
| Labour Co-op | Samuel Perry | 12,718 | 43.5 | −6.0 | |
| Unionist | Owen Parker | 10,212 | 35.0 | −15.5 | |
| Liberal | Alfred Yeo | 6,273 | 21.5 | New | |
| Majority | 2,506 | 8.5 | N/A | ||
| Turnout | 29,203 | 81.3 | +0.3 | ||
| Registered electors | 35,899 | ||||
| Labour Co-op gain from Unionist | Swing | +4.8 | |||
| Party | Candidate | Votes | % | ±% | |
|---|---|---|---|---|---|
| Unionist | Owen Parker | 14,333 | 50.5 | New | |
| Labour Co-op | Alfred Waterson | 14,024 | 49.5 | +1.8 | |
| Majority | 309 | 1.0 | N/A | ||
| Turnout | 28,357 | 81.0 | +15.9 | ||
| Registered electors | 35,024 | ||||
| Unionist gain from Co-operative Party | Swing | N/A | |||
Elections in the 1910s
| Party | Candidate | Votes | % | ±% | |
|---|---|---|---|---|---|
| Co-operative Party | Alfred Waterson | 10,299 | 45.7 | ||
| C | Liberal | Leland William Buxton | 7,761 | 34.4 | |
| National | Algernon Ferguson [26] | 4,489 | 19.9 | ||
| Majority | 2,538 | 11.3 | |||
| Turnout | 22,549 | 65.1 | |||
| Registered electors | 34,624 | ||||
| Co-operative Party win (new seat) | |||||
| C indicates candidate endorsed by the coalition government. | |||||
See also
- 1940 Kettering by-election
- List of parliamentary constituencies in Northamptonshire
Notes
- A county constituency (for the purposes of election expenses and type of returning officer)
- As with all constituencies, the constituency elects one Member of Parliament (MP) by the first past the post system of election at least every five years.
- Before 2010 it contained some eastern wards of the district of Daventry; the predominant parts of which being based around the large villages of Brixworth and Moulton.
- A decrease during the year 2009 was seen to £16,885
References
- "England Parliamentary electorates 2010-2018". Boundary Commission for England. Retrieved 23 March 2019.
- "The Parliamentary Constituencies Order 2023". Schedule I Part I.
- "Eveden.com".
- Foundation, Internet Memory. "[ARCHIVED CONTENT] UK Government Web Archive – The National Archives". www.ons.gov.uk.
- Leigh Rayment's Historical List of MPs – Constituencies beginning with "K" (part 1)
- "Philip Hollobone MP reselected as Conservative Parliamentary candidate for the Kettering Constituency". Kettering Conservatives. Retrieved 24 December 2023.
- "Kettering Constituency". Reform UK. Retrieved 19 January 2024.
- "General Election Candidates". SDP. Retrieved 28 March 2024.
- "'The honour of my life' - Rosie Wrighting chosen as Labour's candidate to fight for Kettering MP seat". Northamptonshire Telegraph. Retrieved 24 December 2023.
- "Kettering Parliamentary constituency". BBC News. BBC. Retrieved 20 November 2019.
- "Election Data 2015". Electoral Calculus. Archived from the original on 17 October 2015. Retrieved 17 October 2015.
- "Rhea Keehn - Kettering Labour Party". Archived from the original on 3 April 2015. Retrieved 6 April 2015.
- "ukip-choose-councillor-as-general-election-candidate-against-conservative-mp-philip-hollobone-1-6534882". Retrieved 30 January 2015.
- "General Election 2017 Candidate - Green Party". Green Party Members' Website.
- "Candidates". English Democrats. Archived from the original on 30 January 2015. Retrieved 30 January 2015.
- "Election Data 2010". Electoral Calculus. Archived from the original on 26 July 2013. Retrieved 17 October 2015.
- "Election Data 2005". Electoral Calculus. Archived from the original on 15 October 2011. Retrieved 18 October 2015.
- "Election Data 2001". Electoral Calculus. Archived from the original on 15 October 2011. Retrieved 18 October 2015.
- "Election Data 1997". Electoral Calculus. Archived from the original on 15 October 2011. Retrieved 18 October 2015.
- "Election Data 1992". Electoral Calculus. Archived from the original on 15 October 2011. Retrieved 18 October 2015.
- "Politics Resources". Election 1992. Politics Resources. 9 April 1992. Archived from the original on 24 July 2011. Retrieved 6 December 2010.
- "Election Data 1987". Electoral Calculus. Archived from the original on 15 October 2011. Retrieved 18 October 2015.
- "Election Data 1983". Electoral Calculus. Archived from the original on 15 October 2011. Retrieved 18 October 2015.
- British Council. "General Election". Retrieved 10 September 2019.
- Craig, F.W.S., ed. (1969). British parliamentary election results 1918-1949. Glasgow: Political Reference Publications. p. 437. ISBN 0-900178-01-9.
- ‘FERGUSON, Brig.-Gen. Algernon Francis Holford’, Who Was Who, A & C Black, an imprint of Bloomsbury Publishing plc, 1920–2016; online edn, Oxford University Press, 2014 ; online edn, April 2014 accessed 18 Sept 2017
Sources
- Craig, F. W. S. (1983) [1969]. British parliamentary election results 1918-1949 (3rd ed.). Chichester: Parliamentary Research Services. ISBN 0-900178-06-X.