Smith County, Mississippi
Smith County is a county located in the U.S. state of Mississippi. As of the 2020 census, the population was 14,209.[1] Its county seat is Raleigh.[2]
Smith County | |
|---|---|
 Smith County courthouse in Raleigh | |
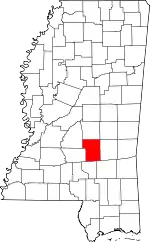 Location within the U.S. state of Mississippi | |
 Mississippi's location within the U.S. | |
| Coordinates: 32°01′N 89°30′W | |
| Country | |
| State | |
| Founded | 1833 |
| Named for | David Smith |
| Seat | Raleigh |
| Largest town | Raleigh |
| Area | |
| • Total | 637 sq mi (1,650 km2) |
| • Land | 636 sq mi (1,650 km2) |
| • Water | 1.0 sq mi (3 km2) 0.2% |
| Population (2020) | |
| • Total | 14,209 |
| • Density | 22/sq mi (8.6/km2) |
| Time zone | UTC−6 (Central) |
| • Summer (DST) | UTC−5 (CDT) |
| Congressional district | 3rd |
| Website | www |
History
Smith County is named for Major David Smith.
Geography
According to the U.S. Census Bureau, the county has a total area of 637 square miles (1,650 km2), of which 636 square miles (1,650 km2) is land and 1.0 square mile (2.6 km2) (0.2%) is water.[3]
Major highways
 Mississippi Highway 13
 Mississippi Highway 18
 Mississippi Highway 28
 Mississippi Highway 35
 Mississippi Highway 37
 Mississippi Highway 540
 Mississippi Highway 481
 Mississippi Highway 501
 Mississippi Highway 902
Adjacent counties
- Scott County (north)
- Jasper County (east)
- Jones County (southeast)
- Covington County (south)
- Simpson County (west)
- Rankin County (northwest)
National protected area
- Bienville National Forest (part)
Demographics
| Census | Pop. | Note | %± |
|---|---|---|---|
| 1840 | 1,961 | — | |
| 1850 | 4,071 | 107.6% | |
| 1860 | 7,638 | 87.6% | |
| 1870 | 7,126 | −6.7% | |
| 1880 | 8,088 | 13.5% | |
| 1890 | 10,635 | 31.5% | |
| 1900 | 13,055 | 22.8% | |
| 1910 | 16,603 | 27.2% | |
| 1920 | 16,178 | −2.6% | |
| 1930 | 18,405 | 13.8% | |
| 1940 | 19,403 | 5.4% | |
| 1950 | 16,740 | −13.7% | |
| 1960 | 14,303 | −14.6% | |
| 1970 | 13,561 | −5.2% | |
| 1980 | 15,077 | 11.2% | |
| 1990 | 14,798 | −1.9% | |
| 2000 | 16,182 | 9.4% | |
| 2010 | 16,491 | 1.9% | |
| 2020 | 14,209 | −13.8% | |
| 2023 (est.) | 14,099 | [4] | −0.8% |
| U.S. Decennial Census[5] 1790-1960[6] 1900-1990[7] 1990-2000[8] 2010-2013[9] | |||
| Race | Num. | Perc. |
|---|---|---|
| White (non-Hispanic) | 10,582 | 74.47% |
| Black or African American (non-Hispanic) | 3,111 | 21.89% |
| Native American | 20 | 0.14% |
| Asian | 19 | 0.13% |
| Other/Mixed | 279 | 1.96% |
| Hispanic or Latino | 198 | 1.39% |
As of the 2020 United States census, there were 14,209 people, 5,820 households, and 4,109 families residing in the county.
Politics
| Year | Republican | Democratic | Third party | |||
|---|---|---|---|---|---|---|
| No. | % | No. | % | No. | % | |
| 2020 | 6,458 | 77.55% | 1,791 | 21.51% | 78 | 0.94% |
| 2016 | 5,928 | 77.72% | 1,617 | 21.20% | 82 | 1.08% |
| 2012 | 6,049 | 74.69% | 1,979 | 24.44% | 71 | 0.88% |
| 2008 | 6,265 | 75.44% | 1,968 | 23.70% | 72 | 0.87% |
| 2004 | 5,577 | 78.33% | 1,496 | 21.01% | 47 | 0.66% |
| 2000 | 4,838 | 74.11% | 1,620 | 24.82% | 70 | 1.07% |
| 1996 | 3,371 | 58.47% | 1,858 | 32.23% | 536 | 9.30% |
| 1992 | 4,106 | 60.49% | 1,968 | 28.99% | 714 | 10.52% |
| 1988 | 4,573 | 72.76% | 1,660 | 26.41% | 52 | 0.83% |
| 1984 | 5,116 | 76.24% | 1,573 | 23.44% | 21 | 0.31% |
| 1980 | 3,772 | 59.50% | 2,474 | 39.02% | 94 | 1.48% |
| 1976 | 3,147 | 54.75% | 2,434 | 42.35% | 167 | 2.91% |
| 1972 | 4,419 | 92.35% | 329 | 6.88% | 37 | 0.77% |
| 1968 | 437 | 8.48% | 352 | 6.83% | 4,367 | 84.70% |
| 1964 | 4,045 | 94.44% | 238 | 5.56% | 0 | 0.00% |
| 1960 | 353 | 11.98% | 1,568 | 53.22% | 1,025 | 34.79% |
| 1956 | 277 | 10.89% | 2,055 | 80.81% | 211 | 8.30% |
| 1952 | 738 | 24.39% | 2,288 | 75.61% | 0 | 0.00% |
| 1948 | 33 | 1.48% | 295 | 13.23% | 1,901 | 85.28% |
| 1944 | 165 | 6.30% | 2,456 | 93.70% | 0 | 0.00% |
| 1940 | 27 | 1.46% | 1,826 | 98.49% | 1 | 0.05% |
| 1936 | 17 | 1.00% | 1,676 | 98.94% | 1 | 0.06% |
| 1932 | 17 | 1.07% | 1,576 | 98.81% | 2 | 0.13% |
| 1928 | 419 | 22.42% | 1,450 | 77.58% | 0 | 0.00% |
| 1924 | 49 | 4.22% | 1,081 | 93.11% | 31 | 2.67% |
| 1920 | 265 | 21.10% | 968 | 77.07% | 23 | 1.83% |
| 1916 | 30 | 2.28% | 1,271 | 96.51% | 16 | 1.21% |
| 1912 | 12 | 1.31% | 854 | 93.13% | 51 | 5.56% |
References
- "Census - Geography Profile: Smith County, Mississippi". United States Census Bureau. Retrieved January 15, 2023.
- "Find a County". National Association of Counties. Retrieved June 7, 2011.
- "2010 Census Gazetteer Files". United States Census Bureau. August 22, 2012. Archived from the original on September 28, 2013. Retrieved November 7, 2014.
- "Annual Estimates of the Resident Population for Counties: April 1, 2020 to July 1, 2023". United States Census Bureau. Retrieved April 5, 2024.
- "U.S. Decennial Census". United States Census Bureau. Retrieved November 7, 2014.
- "Historical Census Browser". University of Virginia Library. Retrieved November 7, 2014.
- "Population of Counties by Decennial Census: 1900 to 1990". United States Census Bureau. Retrieved November 7, 2014.
- "Census 2000 PHC-T-4. Ranking Tables for Counties: 1990 and 2000" (PDF). United States Census Bureau. Archived (PDF) from the original on March 27, 2010. Retrieved November 7, 2014.
- "State & County QuickFacts". United States Census Bureau. Retrieved September 5, 2013.
- "Explore Census Data". data.census.gov. Retrieved December 17, 2021.
- Presidential Elections Results in Smith County, Mississippi, uselectionatlas.org; accessed December 5, 2017.
External links
- Smith County official website
 Media related to Smith County, Mississippi at Wikimedia Commons
- Mississippi Courthouses – Smith County
Places adjacent to Smith County, Mississippi | ||||||||||||||||
|---|---|---|---|---|---|---|---|---|---|---|---|---|---|---|---|---|
| ||||||||||||||||
Municipalities and communities of Smith County, Mississippi, United States | ||
|---|---|---|
| Towns | Map of Mississippi highlighting Smith County | |
| Villages | ||
| Unincorporated communities |
| |
| ||
This article is issued from Wikipedia. The text is licensed under Creative Commons - Attribution - Sharealike. Additional terms may apply for the media files.