1961 South African general election
General elections were held in South Africa on 18 October 1961.[1] They were the first general elections after South Africa became a republic following the 1960 South African referendum. The National Party under H. F. Verwoerd won a majority in the House of Assembly.
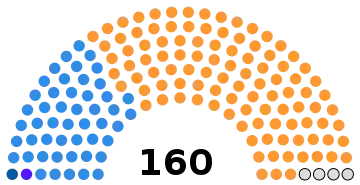
| |||||||||||||||||||||||||||||||||||||||||||||||||||||||||||
All 156 general roll seats in the House of Assembly 79 seats needed for a majority | |||||||||||||||||||||||||||||||||||||||||||||||||||||||||||
|---|---|---|---|---|---|---|---|---|---|---|---|---|---|---|---|---|---|---|---|---|---|---|---|---|---|---|---|---|---|---|---|---|---|---|---|---|---|---|---|---|---|---|---|---|---|---|---|---|---|---|---|---|---|---|---|---|---|---|---|
| Registered | 1,811,160 | ||||||||||||||||||||||||||||||||||||||||||||||||||||||||||
| Turnout | 44.55% ( | ||||||||||||||||||||||||||||||||||||||||||||||||||||||||||
| |||||||||||||||||||||||||||||||||||||||||||||||||||||||||||
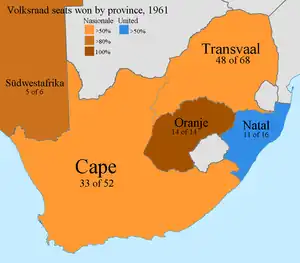 Results by province | |||||||||||||||||||||||||||||||||||||||||||||||||||||||||||
| |||||||||||||||||||||||||||||||||||||||||||||||||||||||||||
.jpg.webp)
.jpg.webp)
.jpg.webp)
| This article is part of a series on the |
| Politics of South Africa |
|---|
.svg.png.webp) |
|
|
The National Union Party - led by Japie Basson and ex-Chief Justice Henry Allan Fagan in alliance with the United Party - had been formed as a "bridge" to the United Party by disgrunted ex-Nationalists who were unhappy with Verwoerd's leadership, aiming at the National, Afrikaner electorate. With the exception of the constituency of Bezuidenhout, won by Basson in a landslide, the party failed and later merged with the United Party.
The elections also saw the first general election appearance of the liberal Progressive Party, which had broken away from the United Party in 1959. The new party retained one MP, in the form of Helen Suzman. She was to remain its sole parliamentary representative until 1974.
Changes in franchise
End of black representation
During the previous Parliament the seats of the three MPs and four Senators representing black South Africans had been abolished. The 1961 election produced the first Parliament with no representation at all for black South Africans.[2]
Coloured Representative Members
The second election for the four Coloured representative members took place on 4 October 1961, before the (white voters only) general election on 18 October 1961. Under the Separate Representation of Voters Act 1951, the members were to serve until the dissolution of the new Parliament.
The four seats were won by Independents, with United Party support. The recently formed Progressive Party did not contest the four vacancies.[3]
Reduction in voting age
This was the first election after the passage of the Electoral Law Amendment Act, No. 30 of 1958, which reduced the voting age for white voters from 21 to 18.[4]
Delimitation of electoral divisions
The South Africa Act 1909 had provided for a delimitation commission to define the boundaries for each electoral division, for general roll voters in the four provinces. The representation by province, under the eleventh delimitation report of 1958, is set out in the table below. The figures in brackets are the number of electoral divisions in the previous (1953) delimitation. If there is no figure in brackets then the number was unchanged.[5]
This was only the second general election, in South African history, where the boundaries were unchanged from the previous election.
| Provinces | Cape | Natal | Orange Free State | Transvaal | Total |
|---|---|---|---|---|---|
| Divisions | 52 (54) | 16 (15) | 14 (13) | 68 | 150 |
Composition at the dissolution
At the end of the 12th Parliament elected since the Union of 1910, when it was dissolved in 1961, the House of Assembly consisted of two groups of members. White voters were represented by 156 general roll members and coloured voters in Cape Province by four white MPs known at the time as Coloured Representative Members (CRM).
The general election only affected the representatives of white voters. The other members were elected on a different date (see above).
The representation by party and province, at the dissolution was:-[6]
| Province | National | United | Progressive | National Union | CRM | Total |
|---|---|---|---|---|---|---|
| Cape (general) | 33 | 14 | 5 | - | - | 52 |
| Cape (CRM) | - | - | - | - | 4 | 4 |
| Natal | 2 | 11 | 3 | - | - | 16 |
| Orange Free State | 14 | - | - | - | - | 14 |
| South-West Africa | 5 | - | - | 1 | - | 6 |
| Transvaal | 48 | 17 | 3 | - | - | 68 |
| Total | 102 | 42 | 11 | 1 | 4 | 160 |
Results
A total of 70 seats were uncontested, of which 50 were won by the National Party and 20 by the United Party.
 | |||||
|---|---|---|---|---|---|
| Party | Votes | % | Seats | +/– | |
| National Party | 370,395 | 46.44 | 105 | +2 | |
| United Party | 281,361 | 35.28 | 49 | –4 | |
| Progressive Party | 69,045 | 8.66 | 1 | New | |
| National Union | 50,279 | 6.30 | 1 | New | |
| Conservative Workers' Party | 8,554 | 1.07 | 0 | New | |
| United National South West Party | 6,856 | 0.86 | 0 | 0 | |
| Independent Republican Party | 2,903 | 0.36 | 0 | New | |
| Liberal Party | 2,461 | 0.31 | 0 | 0 | |
| Independents | 5,707 | 0.72 | 0 | 0 | |
| Coloured Representative Members | 4 | 0 | |||
| Total | 797,561 | 100.00 | 160 | –3 | |
| Valid votes | 797,561 | 99.44 | |||
| Invalid/blank votes | 4,518 | 0.56 | |||
| Total votes | 802,079 | 100.00 | |||
| Registered voters/turnout | 1,811,160 | 44.29 | |||
| Source: Potgieter[7] | |||||
By province
| Province | National | United | Progressive | National Union | Independents | Total |
|---|---|---|---|---|---|---|
| Cape (general) | 34 | 18 | 0 | 0 | 0 | 52 |
| Cape (CRM) | 0 | 0 | 0 | 0 | 4 | 4 |
| Natal | 2 | 14 | 0 | 0 | 0 | 16 |
| Orange Free State | 14 | 0 | 0 | 0 | 0 | 14 |
| South-West Africa | 6 | 0 | 0 | 0 | 0 | 6 |
| Transvaal | 49 | 17 | 1 | 1 | 0 | 68 |
| Total | 105 | 49 | 1 | 1 | 4 | 160 |
By electoral division
Province |
Constituency |
National |
United |
National Union |
Progressive |
Conservative Workers' |
Liberal |
Independent |
Invalid/blank |
Total |
Registered voters |
Turnout |
|---|---|---|---|---|---|---|---|---|---|---|---|---|
| Cape of Good Hope | Albany | 6,069 | 1,175 | 64 | 7,308 | 11,521 | 63.43 | |||||
| Aliwal | 5,148 | 3,767 | 60 | 8,975 | 9,679 | 92.73 | ||||||
| Beaufort West | Unopposed | |||||||||||
| Bellville | 8,274 | 3,995 | 71 | 12,340 | 14,953 | 82.53 | ||||||
| Ceres | Unopposed | |||||||||||
| Constantia | 7,653 | 1,115 | 43 | 8,811 | 13,499 | 65.27 | ||||||
| Cradock | Unopposed | |||||||||||
| De Aar—Colesberg | Unopposed | |||||||||||
| Fort Beaufort | 4,962 | 3,597 | 41 | 8,600 | 9,388 | 91.61 | ||||||
| George | 7,624 | 1,379 | 506 | 45 | 9,554 | 10,967 | 87.12 | |||||
| Gordonia | Unopposed | |||||||||||
| Graaff-Reinet | Unopposed | |||||||||||
| Green Point | Unopposed | |||||||||||
| Hottentots-Holland | 5,806 | 4,264 | 49 | 10,119 | 10,926 | 92.61 | ||||||
| Humansdorp | 5,979 | 3,154 | 20 | 9,153 | 10,414 | 87.89 | ||||||
| Cape Town Gardens | Unopposed | |||||||||||
| Kimberley North | 6,566 | 4,004 | 71 | 10,641 | 12,213 | 87.13 | ||||||
| Kimberley South | 6,359 | 4,925 | 43 | 11,327 | 12,629 | 89.69 | ||||||
| King William’s Town | Unopposed | |||||||||||
| Kuruman | Unopposed | |||||||||||
| Maitland | 4,610 | 1,688 | 3,703 | 27 | 10,028 | 12,336 | 81.29 | |||||
| Malmesbury | Unopposed | |||||||||||
| Moorreesburg | Unopposed | |||||||||||
| Mossel Bay | Unopposed | |||||||||||
| Namakwaland | Unopposed | |||||||||||
| East London North | 6,158 | 2,519 | 58 | 8,735 | 12,984 | 67.28 | ||||||
| East London City | 6,053 | 1,277 | 40 | 7,370 | 12,304 | 59.90 | ||||||
| Oudtshoorn | Unopposed | |||||||||||
| Paarl | 7,272 | 2,893 | 36 | 10,201 | 11,676 | 87.37 | ||||||
| Parow | Unopposed | |||||||||||
| Pinelands | 6,433 | 2,881 | 68 | 9,382 | 12,730 | 73.70 | ||||||
| Piketberg | Unopposed | |||||||||||
| Port Elizabeth North | 6,763 | 3,995 | 29 | 10,787 | 13,842 | 77.93 | ||||||
| Port Elizabeth Central | Unopposed | |||||||||||
| Port Elizabeth South | 5,896 | 3,166 | 74 | 9,136 | 13,189 | 69.27 | ||||||
| Port Elizabeth West | Unopposed | |||||||||||
| Prieska | 5,059 | 3,244 | 40 | 8,343 | 9,100 | 91.68 | ||||||
| Queenstown | 5,706 | 5,337 | 78 | 11,121 | 11,440 | 97.21 | ||||||
| Rondebosch | Unopposed | |||||||||||
| Sea Point | 6,199 | 3,428 | 53 | 9,680 | 12,997 | 74.48 | ||||||
| Simonstown | 6,244 | 1,612 | 60 | 7,916 | 13,071 | 60.56 | ||||||
| Somerset East | Unopposed | |||||||||||
| Salt River | 4,670 | 2,190 | 56 | 6,916 | 10,757 | 64.29 | ||||||
| Stellenbosch | 7,465 | 2,556 | 721 | 43 | 10,785 | 13,247 | 81.41 | |||||
| Swellendam | 5,552 | 3,762 | 61 | 9,375 | 10,277 | 91.22 | ||||||
| Transkeian Territories | Unopposed | |||||||||||
| Uitenhage | Unopposed | |||||||||||
| False Bay | 6,731 | 3,781 | 57 | 10,569 | 12,750 | 82.89 | ||||||
| Vasco | Unopposed | |||||||||||
| Vryburg | Unopposed | |||||||||||
| Worcester | 6,832 | 3,175 | 56 | 10,063 | 11,424 | 88.09 | ||||||
| Wynberg | 6,311 | 1,911 | 18 | 8,240 | 11,402 | 72.27 | ||||||
| Natal | Drakensberg | Unopposed | ||||||||||
| Durban—Berea | 5,451 | 4,568 | 58 | 10,077 | 12,986 | 77.60 | ||||||
| Durban—Musgrave | 5,181 | 4,222 | 33 | 9,436 | 12,575 | 75.04 | ||||||
| Durban North | 6,167 | 3,991 | 91 | 10,249 | 13,463 | 76.13 | ||||||
| Durban Point | Unopposed | |||||||||||
| Durban Central | 5,349 | 504 | 43 | 5,896 | 12,167 | 48.46 | ||||||
| Durban-Umbilo | Unopposed | |||||||||||
| Durban Umlazi | Unopposed | |||||||||||
| Natal South Coast | 4,956 | 2,367 | 115 | 104 | 7,542 | 10,164 | 74.20 | |||||
| Newcastle | 5,919 | 3,646 | 65 | 9,630 | 11,123 | 86.58 | ||||||
| Pietermaritzburg District | 4,014 | 3,839 | 83 | 7,936 | 11,488 | 69.08 | ||||||
| Pietermaritzburg City | 3,915 | 3,282 | 129 | 7,326 | 13,621 | 53.78 | ||||||
| Pinetown | 5,032 | 3,064 | 79 | 8,175 | 11,506 | 71.05 | ||||||
| Umhlatuzana | Unopposed | |||||||||||
| Vryheid | 5,555 | 2,804 | 109 | 8,468 | 9,768 | 86.69 | ||||||
| Zululand | 4,200 | 5,856 | 104[lower-alpha 1] | 55 | 10,215 | 11,738 | 87.03 | |||||
| Orange Free State | Bethlehem | Unopposed | ||||||||||
| Bloemfontein District | Unopposed | |||||||||||
| Bloemfontein East | 7,485 | 3,201 | 16 | 10,702 | 14,830 | 72.16 | ||||||
| Bloemfontein West | 8,076 | 3,645 | 16 | 11,737 | 14,678 | 79.96 | ||||||
| Fauresmith—Boshof | Unopposed | |||||||||||
| Harrismith | Unopposed | |||||||||||
| Heilbron | Unopposed | |||||||||||
| Kroonstad | 7,524 | 1,837 | 65 | 9,426 | 11,133 | 84.67 | ||||||
| Ladybrand | Unopposed | |||||||||||
| Odendaalsrus | 7,797 | 2,304 | 49 | 10,150 | 13,445 | 75.49 | ||||||
| Smithfield | Unopposed | |||||||||||
| Vredefort | Unopposed | |||||||||||
| Welkom | 8,217 | 3,890 | 32 | 12,139 | 15,904 | 76.33 | ||||||
| Winburg | Unopposed | |||||||||||
| South-West Africa | Etosha | Unopposed | ||||||||||
| Karas | 2,954 | 2,113[lower-alpha 2] | 26 | 5,093 | 5,722 | 89.01 | ||||||
| Middelland | 3,264 | 2,135[lower-alpha 2] | 40 | 5,439 | 6,560 | 82.91 | ||||||
| Namib | Unopposed | |||||||||||
| Omaruru | Unopposed | |||||||||||
| Windhoek | 3,709 | 2,608[lower-alpha 2] | 74 | 6,391 | 8,021 | 79.68 | ||||||
| Transvaal | Alberton | 7,099 | 2,094 | 29 | 9,222 | 13,429 | 68.67 | |||||
| Benoni | 3,957 | 1,293 | 52 | 5,302 | 12,112 | 43.77 | ||||||
| Bethal-Middelburg | 5,757 | 2,521 | 51 | 8,329 | 10,216 | 81.53 | ||||||
| Bezuidenhout | 1,983 | 6,507 | 26 | 8,516 | 11,839 | 71.93 | ||||||
| Boksburg | 6,920 | 5,413 | 35 | 12,368 | 14,051 | 88.02 | ||||||
| Brakpan | 6,158 | 3,629 | 96 | 9,883 | 12,559 | 78.69 | ||||||
| Brits | Unopposed | |||||||||||
| Christiana | 6,438 | 2,322 | 51 | 8,811 | 10,015 | 87.98 | ||||||
| Edenvale | 6,509 | 3,812 | 29 | 10,350 | 13,781 | 75.10 | ||||||
| Ermelo | 5,520 | 2,811 | 71 | 8,402 | 9,926 | 84.65 | ||||||
| Florida | 4,473 | 6,407 | 28 | 10,908 | 12,750 | 85.55 | ||||||
| Geduld | 7,006 | 3,576 | 33 | 10,615 | 13,922 | 76.25 | ||||||
| Germiston | 6,239 | 2,053 | 31 | 8,323 | 11,015 | 75.56 | ||||||
| Germiston District | 3,675 | 6,691 | 22 | 10,388 | 13,362 | 77.74 | ||||||
| Groblersdal | Unopposed | |||||||||||
| Heidelberg | Unopposed | |||||||||||
| Hercules | Unopposed | |||||||||||
| Hillbrow | 5,564 | 1,346 | 45 | 6,955 | 12,690 | 54.81 | ||||||
| Hospital | 4,799 | 992 | 30 | 5,821 | 10,877 | 53.52 | ||||||
| Houghton | 4,841 | 5,405 | 69 | 10,315 | 12,771 | 80.77 | ||||||
| Innesdal | Unopposed | |||||||||||
| Jeppes | Unopposed | |||||||||||
| Johannesburg North | 5,413 | 4,541 | 67 | 10,021 | 13,245 | 75.66 | ||||||
| Kempton Park | Unopposed | |||||||||||
| Kensington | Unopposed | |||||||||||
| Klerksdorp | 8,912 | 3,226 | 108 | 33 | 12,279 | 15,705 | 78.19 | |||||
| Krugersdorp | 6,023 | 3,831 | 47 | 9,901 | 12,555 | 78.86 | ||||||
| Langlaagte | 5,891 | 2,325 | 58 | 8,274 | 11,844 | 69.86 | ||||||
| Lichtenburg | Unopposed | |||||||||||
| Losberg | Unopposed | |||||||||||
| Lydenburg—Barberton | 5,326 | 2,849 | 79 | 8,254 | 9,758 | 84.59 | ||||||
| Maraisburg | Unopposed | |||||||||||
| Marico | 5,429 | 2,390 | 54 | 7,873 | 9,061 | 86.89 | ||||||
| Mayfair | 5,431 | 2,039 | 34 | 7,504 | 11,176 | 67.14 | ||||||
| Nelspruit | 5,790 | 3,059 | 37 | 8,886 | 10,564 | 84.12 | ||||||
| Nigel | Unopposed | |||||||||||
| North East Rand | Unopposed | |||||||||||
| North West Rand | 6,495 | 4,774 | 29 | 11,298 | 13,118 | 86.13 | ||||||
| Orange Grove | 5,363 | 4,846 | 65 | 10,274 | 12,594 | 81.58 | ||||||
| Parktown | 5,100 | 5,015 | 65 | 10,180 | 12,458 | 81.71 | ||||||
| Pietersburg | 6,201 | 2,200 | 58 | 8,459 | 10,766 | 78.57 | ||||||
| Potchefstroom | Unopposed | |||||||||||
| Pretoria District | 6,753 | 3,666 | 82 | 10,501 | 12,642 | 83.06 | ||||||
| Pretoria East | 9,155 | 2,622 | 89 | 11,866 | 16,119 | 73.61 | ||||||
| Pretoria—Rissik | 6,149 | 6,713 | 40 | 12,902 | 14,629 | 88.19 | ||||||
| Pretoria Central | Unopposed | |||||||||||
| Pretoria—Sunnyside | 7,528 | 4,801 | 27 | 12,356 | 15,521 | 79.61 | ||||||
| Pretoria West | Unopposed | |||||||||||
| Prinshof | Unopposed | |||||||||||
| Randfontein | 6,227 | 3,280 | 120 | 9,627 | 11,772 | 81.78 | ||||||
| Roodepoort | 7,532 | 3,284 | 36 | 10,852 | 13,245 | 81.93 | ||||||
| Rosettenville | Unopposed | |||||||||||
| Rustenburg | 5,886 | 2,544 | 40 | 8,470 | 10,448 | 81.07 | ||||||
| Soutpansberg | Unopposed | |||||||||||
| Springs | Unopposed | |||||||||||
| Standerton | 5,340 | 3,139 | 58 | 8,537 | 10,066 | 84.81 | ||||||
| Turffontein | Unopposed | |||||||||||
| Vanderbijl Park | Unopposed | |||||||||||
| Ventersdorp | 6,509 | 2,805 | 55 | 9,369 | 11,677 | 80.23 | ||||||
| Vereeniging | 6,465 | 4,745 | 60 | 11,270 | 13,043 | 86.41 | ||||||
| Von Brandis | Unopposed | |||||||||||
| Wakketstroom | Unopposed | |||||||||||
| Waterberg | Unopposed | |||||||||||
| Westdene | 6,167 | 2,137 | 39 | 8,343 | 11,859 | 70.35 | ||||||
| Witbank | Unopposed | |||||||||||
| Wolmaransstad | 6,611 | 2,142 | 20 | 8,773 | 10,633 | 82.51 | ||||||
| Wonderboom | Unopposed | |||||||||||
| Yeoville | Unopposed | |||||||||||
| Source: Government Gazette 110 | ||||||||||||
References
- Stultz, Newell M.; Butler, Jeffrey (March 1963). "The South African General Election of 1961". Political Science Quarterly. 78 (1). Academy of Political Science: 86–110. doi:10.2307/2146669. JSTOR 2146669.
- In No Uncertain Terms, page 44.
- Keesing’s Contemporary Archives, 1961–1962, page 18449
- Horrell, Muriel. A Survey of Race Relations in South Africa, 1957–1958 (PDF). South African Institute of Race Relations. p. 10. Retrieved 28 June 2011.
- South Africa 1982, page 129 (table setting out delimitations of seats by province, the relevant one being that of 1958)
- Keesing's Contemporary Archives, 1960–1961, page 18449
- Dirk J. Potgieter (1971) Standard Encyclopaedia of Southern Africa, Volume 4, p273
- In No Uncertain Terms, by Helen Suzman (Mandarin Paperback 1994)
- Keesing's Contemporary Archives
- South Africa 1982 Official Yearbook of the Republic of South Africa, published by Chris van Rensburg Publications
Notes
- Withdrew before election day
- United National South West Party
| General elections | |
|---|---|
| Provincial elections | |
| Municipal elections | |
| Referendums | |
| |