wikiHow is a “wiki,” similar to Wikipedia, which means that many of our articles are co-written by multiple authors. To create this article, volunteer authors worked to edit and improve it over time.
The wikiHow Tech Team also followed the article's instructions and verified that they work.
This article has been viewed 106,450 times.
Learn more...
It's impossible to run a business without relevant and accurate metrics. Going without them is like steering a ship with no radar in zero visibility. Although you can spend hundreds -- even thousands -- of dollars on professionally designed bookkeeping and business planning software, you can get the same information by setting up Microsoft Excel or a similar spreadsheet program. This process is well within the reach of even beginners at computer operations, and should take less than 1 hour once you've gathered your data.
Steps
-
1Gather the data relevant to the growth you want to calculate. You might want to calculate overall growth of an investment, growth of a certain expense base, growth of sales or any other facet of your business or personal investments.
- You will need information for at least 2 complete and consecutive years if you want to calculate meaningfully comparable annual growth rates.
- If calculating the annual growth of gross income for a business, you would need all the income for all departments of your business, for example sales receipts or bank statements showing all deposits.
-
2Total all the relevant numbers for the area on which you want to run this calculation. Calculate each year separately.
- For example, calculating sales growth in a department will mean totaling all sales numbers for that department for each year, but not sales numbers for other departments or expense numbers.
- For robust analysis of your business performance, you will want to do this for gross income, gross profit, net profit and meaningful statistics from each location and/or department.
Advertisement -
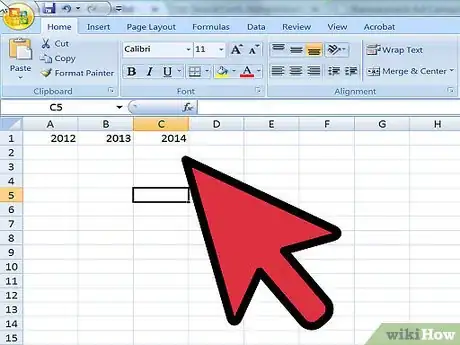
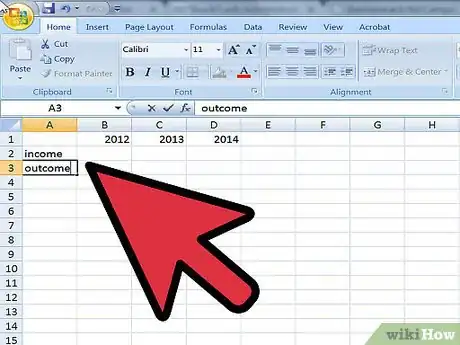
3Enter the earliest year for which you have numbers in line 2, column A of your Excel spreadsheet. Enter the next year in line 3, column A.
-
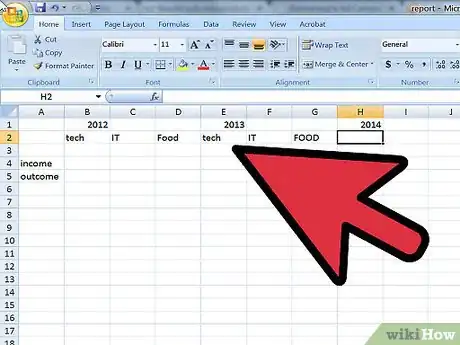
4Enter departments and areas in column B, C, D, etc. of line 1. If you're only doing 1 comparison, you only need 1 column.
-
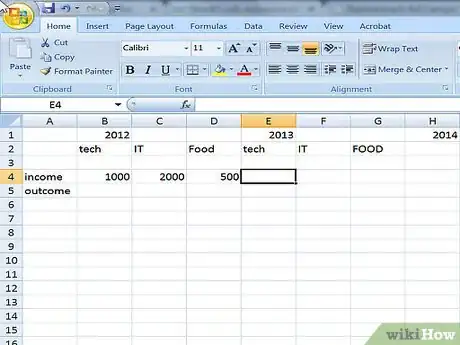
5Enter the appropriate totals from earlier steps in the appropriate cells. For example, if you had 2007 in line 2, 2008 in line 3, sales in column A and net profit in column B. The total sales for 2008 would go in cell 3A and the net profit for 2007 would go in cell 2B.
-
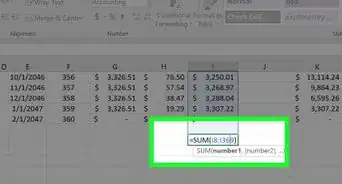
6Enter the following formula in line 4, column B: "(+B3/B2*100)-100". This will instruct Microsoft Excel to enter the difference between performance for the 2 years, expressing as percentage growth.
-
7Copy and paste the contents of cell B4 to other cells where you need the annual growth rate. Excel will automatically change the formula to reflect the new location.

