X
This article was co-authored by wikiHow staff writer, Jack Lloyd. Jack Lloyd is a Technology Writer and Editor for wikiHow. He has over two years of experience writing and editing technology-related articles. He is technology enthusiast and an English teacher.
The wikiHow Tech Team also followed the article's instructions and verified that they work.
This article has been viewed 426,467 times.
Learn more...
This wikiHow teaches you how to find the standard deviation of a set of data in Microsoft Excel.
Steps
-
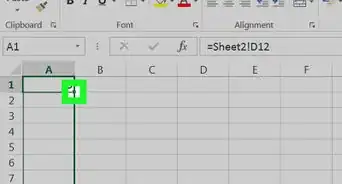
1Open Microsoft Excel. Click or double-click the Microsoft Excel app icon, which resembles a white "X" on a dark-green background. The Excel launch page will open.
- If you have an Excel document which contains the data you want to use, double-click the document to open it in Excel, then skip ahead to the "Click a blank cell" step.
-
2Click Blank Workbook. It's in the upper-left side of the Excel launch page.Advertisement
-
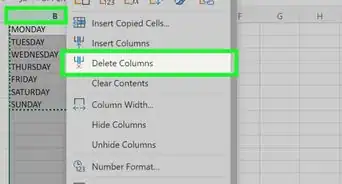
3Enter the values you want to use. Pick a column in which you want to enter your data, then type each data value into individual cells in that column.
- For example, if you select column "A" as the area in which to enter your data, you might type a number into cell A1, cell A2, cell A3, and so on.
-
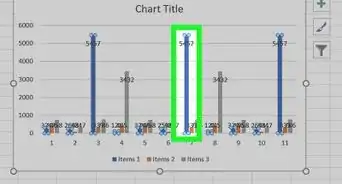
4Click a blank cell. This should be the cell in which you want to display the standard deviation value. Doing so selects the cell.
-
5Type in the standard deviation formula. The formula you'll type into the empty cell is =STDEV.P( ) where "P" stands for "Population". Population standard deviation takes into account all of your data points (N).[1]
- If you want to find the "Sample" standard deviation, you'll instead type in =STDEV.S( ) here. Sample standard deviation takes into account one less value than the number of data points you have (N-1).
-
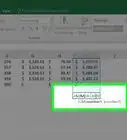
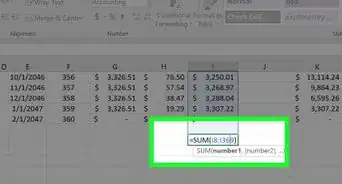
6Add your value range. In between the parentheses, type in the letter and number of the cell containing your first piece of data, type in a colon (:), and type in the letter and number of the last data cell.
- For example, if you entered your data in column "A" from rows 1 through 10, you would have =STDEV.P(A1:A10) typed here.
- If you just want to display the standard deviation of the value of a few scattered cells such as A1, B3, and C5, you can type the cell names separated by commas (e.g., =STDEV.P(A1,B3,C5)) instead.
-
7Press ↵ Enter. This will prompt Excel to execute the formula, thus displaying the standard deviation of your selected cells in the formula's cell.


Advertisement
Community Q&A
-
QuestionHow do I use Excel to calculate 2 standard deviations?
 Community AnswerUse =STDEV(), and put your range of values in the parentheses. This can be 2 cells or 2 values (numbers).
Advertisement
Warnings
- The old =STDEV( ) formula doesn't work in versions of Excel older than 2007.⧼thumbs_response⧽
Advertisement


References
About This Article
Jack Lloyd
wikiHow Technology Writer
This article was co-authored by wikiHow staff writer, Jack Lloyd. Jack Lloyd is a Technology Writer and Editor for wikiHow. He has over two years of experience writing and editing technology-related articles. He is technology enthusiast and an English teacher. This article has been viewed 426,467 times.
How helpful is this?
Co-authors: 7
Updated: November 6, 2020
Views: 426,467
Categories: Microsoft Excel
Advertisement