wikiHow is a “wiki,” similar to Wikipedia, which means that many of our articles are co-written by multiple authors. To create this article, volunteer authors worked to edit and improve it over time.
Learn more...
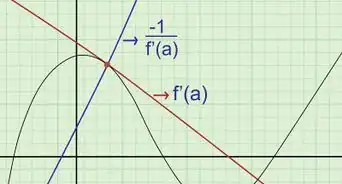
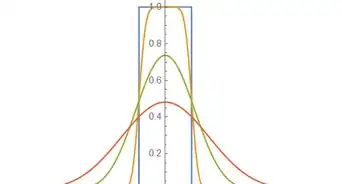
Calculus is the study of change, things studied would be how fast something is (rate of change) or how much of something is there (NET change). A graph shows this relationship of change visually. Derivatives are a significant part of calculus because they are used to find the rate of changes of a quantity with respect to the other quantity. In a function, they tell you the instantaneous rate of change of that function at a specific point. Derivatives also give a slope of any tangent line to a function, which lets you find an equation to the tangent line at that point. In real life, derivative graphs can visually show you what speed you are driving, it can also predict fluctuations in the stock market. Derivatives are particularly important and prevalent in many Calculus problems and can be solved through shortcuts, however, their graphs are not so easy. Due to their relevancy, if you do not have the hang of drafting derivatives, you will face many challenges. However, you can learn how to graph them through the original function it was derived from through simple steps.
Steps
Preparation
-
1Obtain a writing utensil and blank paper.
-
2Find space on a flat surface for you to work on.Advertisement
-
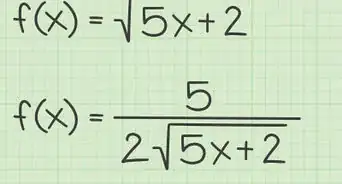
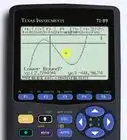
3Examine an original graph that is on a coordinate plane of a function that you can differentiate (make a derivative of.)
- If a graph of a function is not given to you, and you are only given a function test and plot points by inputting numbers as x-values into the function and then plotting their outputs as y-values at those x-values.
-
4Label the original graph f(x).
-
5Draw another coordinate plane with y and x axis labeled like the graph f(x) on your blank paper.
-
6Label this graph “f’(x)”, (f’ is f prime = derivative of f).


General Drawing Rules of Derivative f’(x)
-
1Read your original graph from left to right find any parabolic shapes or shapes where the curve looks flat.
-
2Place a straight object like your pencil on your original function’s curve where the points in “Step 1” lie, to mimic a tangent line.
-
3Plot x-intercepts on your derivative graph f’(x) parallel to where the tangent line’s slope would equal 0 at the specific x-values of the original graphs.
-
4Place the straight object on your original function’s curve starting all the way from the left to the right of the graph to mimic a tangent line around each major point of the axis.
-
5Plot points on your derivative graph based on these tangent line slopes following the curve.
- If you were to put a tangent line on the graph’s curve at that point, and your tangent line is rising upwards from left to right it has a positive slope, plot positive points. If the tangent line is declining from left to right then plot negative points below the x-axis, the less steep the tangent line goes the less positive or negative it'll be.
- If the curve of the original graph f(x) is linear and straight at some interval, then the y-values on the derivative graph would be all the same as a straight linear horizontal line within that same interval.
-
6Acknowledge points on the original graph that are not differentiable meaning they do not look like regular derivatives on a graph, examples of these are corners and cusps.

.jpg)


How to Plot Non-Differentiable Points on f’(x) (Corner)
-
1Place two open dots on f’(x) where corners occur at a y-value corresponding to the tangent line’s slopes on the original graph f(x) going positive or negative (if the tangent line slope is going down negative, place the dot below the x-axis, if the tangent line slope is going positive, place it above the x-axis.)
-
2Continue plotting the curve, as usual, unless there is a linear line on both sides of the corner then make the lines horizontal and straight until the tangent line slope fluctuates to a different y–value.

How to Plot Non-Differentiable Points on f’(x) (Cusp)
-
1Place a vertical asymptote on the graph of f’(x) on the x-value where the cusp occurs on the original graph f(x).
-
2Plot points on f’(x) normally correspond to the graph f(x)’s tangent lines from the direction of the tangent lines' slope.#*If the tangent line’s slopes are negative on the original graph f(x) on one side of the cusp, the curve on the graph f’(x) would be getting closer to that horizontal asymptote as it approaches x going to -∞ y-values, if the tangent line’s slopes are positive on the original graph f(x) on one side of the cusp, the curve on the graph f’(x) would be getting closer to that horizontal asymptote as it approaches x going to positive ∞ y-values