X
wikiHow is a “wiki,” similar to Wikipedia, which means that many of our articles are co-written by multiple authors. To create this article, 10 people, some anonymous, worked to edit and improve it over time.
The wikiHow Tech Team also followed the article's instructions and verified that they work.
This article has been viewed 799,158 times.
Learn more...
Excel is a great option for running multiple regressions when a user doesn't have access to advanced statistical software. The process is fast and easy to learn.
Steps
-
1Open Microsoft Excel.
-
2Check to see if the "Data Analysis" ToolPak is active by clicking on the "Data" tab. If you don't see the option, you will need to enable the add-in, as follows:
- Open the "File" menu (or press Alt+F) and select "Options"
- Click "Add-Ins" on the left side of the window
- Click "Go" next to the "Manage: Add-ins" option at the bottom of window
- In the new window, check the box next to "Analysis ToolPak", then click "OK"
- The add-in is now enabled
Advertisement -
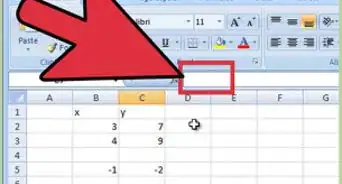
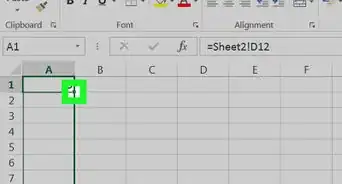
3Enter your data, or open your data file. Data must be arranged in immediately adjacent columns and labels should be in the first row of each column.
-
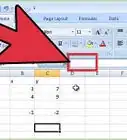
4Select the "Data" tab, then click "Data Analysis" in the "Analysis" grouping (most likely at or near the far right of Data tab options).
-
5Input the dependent (Y) data by first placing the cursor in the "Input Y-Range" field, then highlighting the column of data in the workbook.
-
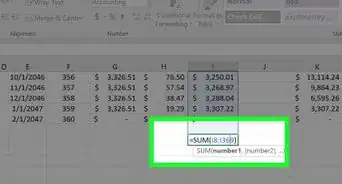
6The independent variables are entered by first placing the cursor in the "Input X-Range" field, then highlighting multiple columns in the workbook (e.g. $C$1:$E$53).
- NOTE: The independent variable data columns MUST be adjacent one another for the input to occur properly.
- If you are using labels (which should, again, be in the first row of each column), click the box next to "Labels".
- The default confidence level is 95%. If you wish to change this value, click the box next to "Confidence Level" and modify the adjacent value.
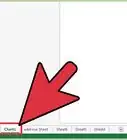
- Under "Output Options", add a name in the "New Worksheet Ply" field.
-
7Select the desired options in the "Residuals" category. Graphical residual outputs are created by with the "Residual Plots" and "Line Fit Plots" options.
-
8Click "OK" and the analysis will be created.


Advertisement
Community Q&A
-
QuestionHow do I report the results of a multiple regression analysis?
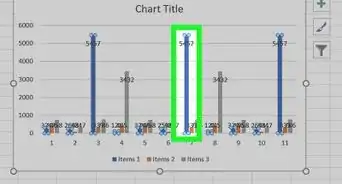
 Community AnswerThe Y axis can only support one column while the x axis supports multiple and will display a multiple regression.
 -
QuestionWhat does it mean if my input range contains non-numeric data?
 Community AnswerIt is possible that one or more of your columns has numbers formatted as text, or there is actual text in those columns.
 -
QuestionMy significance F value is 6.07596E-31. What does that mean?Community AnswerIf you switch the cell format to numerical instead of general, that will fix this problem. This notation of this number is basically saying move the decimal to the left 31 times so it will be a very small number. Since this number is so small I would recommend checking you entered everything in properly but since I have no idea what your data looks like, it could be correct.
Advertisement


About This Article
Advertisement