Midu County
Midu County (simplified Chinese: 弥渡县; traditional Chinese: 彌渡縣; pinyin: Mídù Xiàn) is a county in the Dali Bai Autonomous Prefecture located in west-central Yunnan province, China.
Midu County
弥渡县 | |
|---|---|
.png.webp) Location of Midu County (pink) and Dali Prefecture (yellow) within Yunnan | |
| Country | People's Republic of China |
| Province | Yunnan |
| Autonomous prefecture | Dali |
| Area | |
| • Total | 1,571 km2 (607 sq mi) |
| Population | |
| • Total | 310,000 |
| • Density | 200/km2 (510/sq mi) |
| Time zone | UTC+8 (CST) |
| Postal code | 675600 |
| Area code | 0872 |
| Website | dlmd |
Administrative divisions
Midu County has 6 towns, 1 township and 1 ethnic township.[1]
- 6 towns
|
|
- 1 township
- Deju (德苴乡)
- 1 ethnic township
- Niujie Yi (牛街彝族乡)
| Map |
|---|
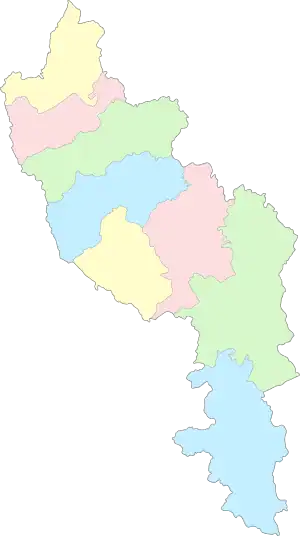
Hongyan
Xinjie
Micheng
Yinjie
Mizhi
Juli
Deju
Niujie Yi |
Ethnic groups
The Midu County Gazetteer (1993:721) lists the following ethnic groups.
- Yi people
- Mocha 墨叉
- Luowu 罗婺
- Tuzu 土族
- Hui people
- Bai people
- Lisu people
- Han people
Transportation
Climate
| Climate data for Midu (1981−2010 normals) | |||||||||||||
|---|---|---|---|---|---|---|---|---|---|---|---|---|---|
| Month | Jan | Feb | Mar | Apr | May | Jun | Jul | Aug | Sep | Oct | Nov | Dec | Year |
| Record high °C (°F) | 23.9 (75.0) |
26.3 (79.3) |
30.3 (86.5) |
32.6 (90.7) |
34.0 (93.2) |
33.2 (91.8) |
32.7 (90.9) |
31.7 (89.1) |
31.8 (89.2) |
29.4 (84.9) |
26.1 (79.0) |
23.1 (73.6) |
34.0 (93.2) |
| Average high °C (°F) | 18.1 (64.6) |
19.7 (67.5) |
22.9 (73.2) |
25.9 (78.6) |
27.0 (80.6) |
27.1 (80.8) |
26.5 (79.7) |
26.7 (80.1) |
25.6 (78.1) |
23.8 (74.8) |
20.6 (69.1) |
18.2 (64.8) |
23.5 (74.3) |
| Daily mean °C (°F) | 9.5 (49.1) |
11.4 (52.5) |
14.8 (58.6) |
18.4 (65.1) |
21.1 (70.0) |
22.2 (72.0) |
21.7 (71.1) |
21.1 (70.0) |
19.7 (67.5) |
17.4 (63.3) |
12.9 (55.2) |
9.7 (49.5) |
16.7 (62.0) |
| Average low °C (°F) | 2.1 (35.8) |
3.8 (38.8) |
7.0 (44.6) |
11.2 (52.2) |
15.7 (60.3) |
18.3 (64.9) |
18.2 (64.8) |
17.3 (63.1) |
15.9 (60.6) |
13.0 (55.4) |
7.1 (44.8) |
3.0 (37.4) |
11.0 (51.9) |
| Record low °C (°F) | −4.7 (23.5) |
−3.4 (25.9) |
−1.4 (29.5) |
3.0 (37.4) |
6.8 (44.2) |
12.9 (55.2) |
12.7 (54.9) |
10.6 (51.1) |
7.2 (45.0) |
4.9 (40.8) |
−0.3 (31.5) |
−5.9 (21.4) |
−5.9 (21.4) |
| Average precipitation mm (inches) | 12.1 (0.48) |
14.7 (0.58) |
17.4 (0.69) |
20.7 (0.81) |
67.0 (2.64) |
127.7 (5.03) |
144.8 (5.70) |
150.7 (5.93) |
119.0 (4.69) |
78.8 (3.10) |
27.4 (1.08) |
8.2 (0.32) |
788.5 (31.05) |
| Average precipitation days (≥ 0.1 mm) | 3.9 | 4.3 | 6.5 | 7.0 | 9.2 | 12.1 | 18.3 | 18.0 | 14.4 | 11.0 | 4.4 | 2.5 | 111.6 |
| Average snowy days | 0.2 | 0 | 0.1 | 0 | 0 | 0 | 0 | 0 | 0 | 0 | 0.1 | 0 | 0.4 |
| Average relative humidity (%) | 61 | 56 | 52 | 52 | 59 | 72 | 79 | 82 | 81 | 77 | 73 | 68 | 68 |
| Mean monthly sunshine hours | 254.6 | 242.8 | 267.0 | 259.4 | 244.1 | 201.0 | 154.8 | 163.3 | 164.3 | 189.4 | 227.5 | 243.0 | 2,611.2 |
| Percent possible sunshine | 76 | 76 | 71 | 68 | 59 | 49 | 37 | 41 | 45 | 53 | 70 | 74 | 60 |
| Source: China Meteorological Administration (precipitation days, snow days, sunshine 1991–2020)[2][3] | |||||||||||||
References
- "国家统计局" (in Chinese). National Bureau of Statistics of the People's Republic of China. Retrieved 2021-12-07.
- 中国气象数据网 – WeatherBk Data (in Simplified Chinese). China Meteorological Administration. Retrieved 9 April 2023.
- 中国气象数据网 (in Simplified Chinese). China Meteorological Administration. Retrieved 9 April 2023.
This article is issued from Wikipedia. The text is licensed under Creative Commons - Attribution - Sharealike. Additional terms may apply for the media files.