Ottawa West—Nepean
Ottawa West—Nepean (French: Ottawa-Ouest—Nepean) is a federal electoral district in Ontario, Canada, that has been represented in the House of Commons of Canada since 1997.
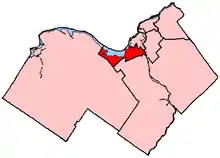 Ottawa West—Nepean in relation to other electoral districts in Ottawa (2003 boundaries) | |||
| Federal electoral district | |||
| Legislature | House of Commons | ||
| MP |
Liberal | ||
| District created | 1996 | ||
| First contested | 1997 | ||
| Last contested | 2021 | ||
| District webpage | profile, map | ||
| Demographics | |||
| Population (2016)[1] | 111,837 | ||
| Electors (2015) | 81,646 | ||
| Area (km²)[2] | 71 | ||
| Pop. density (per km²) | 1,575.2 | ||
| Census division(s) | Ottawa | ||
| Census subdivision(s) | Ottawa | ||
Geography
The district includes the neighbourhoods of Shirleys Bay, Crystal Beach, Rocky Point, Bayshore, Britannia, Britannia Bay, Lincoln Heights, Whitehaven, Glabar Park, Queensway, Kenson Park, Redwood, Graham Park, Qualicum, Leslie Park, Briargreen, Centrepointe, Woodroffe, Bel-Air Park, Bel-Air Heights, Braemar Park, Copeland Park, Navaho, City View, Ryan Farm, Skyline, Fisher Heights, Parkwood Hills, Carleton Heights, Fisher Glen, Borden Farm, Crestview, Meadowlands, Woodpark, and the western half of Carlington in the City of Ottawa.
History
The electoral district was created in 1996 from Ottawa West, Nepean and part of Lanark—Carleton ridings.
The 2012 federal redistribution saw the riding gain a small portion from Ottawa Centre, but it remained largely unchanged.
Demographics
According to the 2021 Canada Census[3]
Ethnic groups: 60.7% White, 8.9% Black, 7.0% South Asian, 5.3% Arab, 4.6% Chinese, 4.1% Indigenous, 2.2% Southeast Asian, 2.0% Filipino, 1.4% Latin American, 1.4% West Asian
Languages: 60.3% English, 6.5% French, 4.2% Arabic, 2.0% Mandarin, 1.7% Italian, 1.4% Spanish, 1.2% Somali, 1.2% Cantonese, 1.1% Vietnamese, 1.0% Tagalog
Religions: 49.3% Christian (26.3% Catholic, 4.0% Anglican, 3.7% United Church, 2.3% Christian Orthodox, 1.3% Pentecostal, 1.0% Presbyterian, 10.7% Other), 10.8% Muslim, 3.3% Hindu, 1.8% Jewish, 1.5% Buddhist, 31.5% None
Median income: $42,800 (2020)
Average income: $55,900 (2020)
Members of Parliament
This riding has elected the following Members of Parliament:
| Parliament | Years | Member | Party | |
|---|---|---|---|---|
| Ottawa West—Nepean Riding created from Ottawa West, Nepean and Lanark—Carleton |
||||
| 36th | 1997–2000 | Marlene Catterall | Liberal | |
| 37th | 2000–2004 | |||
| 38th | 2004–2006 | |||
| 39th | 2006–2008 | John Baird | Conservative | |
| 40th | 2008–2011 | |||
| 41st | 2011–2015 | |||
| 42nd | 2015–2019 | Anita Vandenbeld | Liberal | |
| 43rd | 2019–2021 | |||
| 44th | 2021–present | |||
In the 2004 federal election, Marlene Catterall defeated Conservative Party candidate Sean Casey in a very close election.
In the 2006 federal election, Catterall stepped aside, and high-profile Progressive Conservative Member of Provincial Parliament, John Baird, contested and won the riding for the Conservative Party.
Until February 3, 2015, he was a member of the cabinet of Prime Minister Stephen Harper as Minister of Foreign Affairs. He has also previously served as President of the Treasury Board, then Minister of the Environment, then as Government House Leader. Baird resigned from the House of Commons on March 16, 2015.
Riding associations
Riding associations are the local branches of national political parties:
| Party | Association Name | President | |
| New Democratic | Ottawa West—Nepean Federal NDP Association | Stephen Yardy | |
| Liberal | Ottawa West—Nepean Federal Liberal Association | Christie Boyd | |
| Conservative | Ottawa West—Nepean Conservative Association | Craig Armstrong | |
| Green | Ottawa West—Nepean Green Party | David Stibbe | |
| Christian Heritage | CHP Ottawa West—Nepean | David Darwin | |
Election results
| 2021 Canadian federal election | ||||||||
|---|---|---|---|---|---|---|---|---|
| Party | Candidate | Votes | % | ±% | ||||
| Liberal | Anita Vandenbeld | 25,889 | 45.1 | -0.5 | ||||
| Conservative | Jennifer Jennekens | 16,473 | 28.7 | +1.6 | ||||
| New Democratic | Yavar Hameed | 11,163 | 19.4 | +0.7 | ||||
| People's | David Yeo | 1,908 | 3.3 | +2.0 | ||||
| Green | David Stibbe | 1,642 | 2.9 | -3.4 | ||||
| Christian Heritage | Sean Mulligan | 327 | 0.6 | |||||
| Total valid votes | 57,402 | |||||||
| Total rejected ballots | 447 | |||||||
| Turnout | 57,849 | |||||||
| Eligible voters | 84,392 | |||||||
| Source: Elections Canada[4] | ||||||||
| 2019 Canadian federal election | ||||||||
|---|---|---|---|---|---|---|---|---|
| Party | Candidate | Votes | % | ±% | Expenditures | |||
| Liberal | Anita Vandenbeld | 27,599 | 45.6 | -10.08 | $70,538.89 | |||
| Conservative | Abdul Abdi | 16,491 | 27.1 | -2.78 | none listed | |||
| New Democratic | Angela MacEwen | 11,401 | 18.7 | +8.9 | $61,020.24 | |||
| Green | David Stibbe | 3,823 | 6.3 | +3.5 | none listed | |||
| People's | Serge Guevorkian | 820 | 1.3 | – | $0.00 | |||
| Christian Heritage | Sean Mulligan | 350 | 0.6 | -0.57 | $2,235.59 | |||
| Total valid votes/expense limit | 62,206 | 100.0 | $109,420.82 EST | |||||
| Total rejected ballots | 602 | 0.96 | – | |||||
| Turnout | 62,808 | 72.62 | – | |||||
| Eligible voters | 86,485 | |||||||
| Liberal hold | Swing | +14.11% | ||||||
| Source: Elections Canada[5][6] | ||||||||
| 2015 Canadian federal election | ||||||||
|---|---|---|---|---|---|---|---|---|
| Party | Candidate | Votes | % | ±% | Expenditures | |||
| Liberal | Anita Vandenbeld | 35,199 | 55.68 | +24.19 | $125,416.75 | |||
| Conservative | Abdul Abdi | 18,893 | 29.88 | -14.81 | $195,500.69 | |||
| New Democratic | Marlene Rivier | 6,195 | 9.80 | -9.98 | $48,825.54 | |||
| Green | Mark Brooks | 1,772 | 2.80 | -1.24 | $5,327.90 | |||
| Christian Heritage | Rod Taylor | 740 | 1.17 | – | $34,473.80 | |||
| Marxist–Leninist | Sam Heaton | 114 | 0.18 | – | – | |||
| Total valid votes/Expense limit | 62,913 | 100.0 | $219,678.06 | |||||
| Total rejected ballots | 307 | 0.49 | – | |||||
| Turnout | 63,220 | 75.99 | – | |||||
| Eligible voters | 83,195 | |||||||
| Liberal gain from Conservative | Swing | +19.5% | ||||||
| Source: Elections Canada[7][8] | ||||||||
| 2011 federal election redistributed results[9] | |||
|---|---|---|---|
| Party | Vote | % | |
| Conservative | 25,297 | 44.69 | |
| Liberal | 17,825 | 31.49 | |
| New Democratic | 11,196 | 19.78 | |
| Green | 2,285 | 4.04 | |
| Others | 4 | 0.01 | |
| 2011 Canadian federal election | ||||||||
|---|---|---|---|---|---|---|---|---|
| Party | Candidate | Votes | % | ±% | Expenditures | |||
| Conservative | John Baird | 25,226 | 44.71 | -0.27 | $85,279.84 | |||
| Liberal | Anita Vandenbeld | 17,790 | 31.53 | -4.59 | $83,063.37 | |||
| New Democratic | Marlene Rivier | 11,128 | 19.72 | +8.20 | $27,580.67 | |||
| Green | Mark Mackenzie | 2,279 | 4.04 | -2.32 | $16,343.75 | |||
| Total valid votes/Expense limit | 56,423 | 100.00 | $88,802.24 | |||||
| Total rejected ballots | 292 | 0.51 | – | |||||
| Turnout | 56,715 | 69.42 | – | |||||
| Eligible voters | 81,693 | – | – | |||||
| Conservative hold | Swing | -2.43 | ||||||
| Source: Elections Canada[10] | ||||||||
| 2008 Canadian federal election | ||||||||
|---|---|---|---|---|---|---|---|---|
| Party | Candidate | Votes | % | ±% | Expenditures | |||
| Conservative | John Baird | 25,109 | 44.98 | +1.85 | $83,719 | |||
| Liberal | David Pratt | 20,161 | 36.12 | +2.03 | $84,627 | |||
| New Democratic | Marlene Rivier | 6,432 | 11.52 | -4.60 | $30,086 | |||
| Green | Frances Coates | 3,552 | 6.36 | +1.42 | $9,565 | |||
| Independent | David Page | 415 | 0.74 | +0.74 | * | |||
| Communist | Alex McDonald | 150 | 0.28 | +0.28 | * | |||
| Total valid votes/Expense limit | 55,819 | 100.00 | $87,796 | |||||
| Conservative hold | Swing | -0.09 | ||||||
| 2006 Canadian federal election | ||||||||
|---|---|---|---|---|---|---|---|---|
| Party | Candidate | Votes | % | ±% | Expenditures | |||
| Conservative | John Baird | 25,607 | 43.13 | +3.93 | $73,698 | |||
| Liberal | Lee Farnworth | 20,244 | 34.09 | -7.50 | $71,412 | |||
| New Democratic | Marlene Rivier | 9,569 | 16.12 | +3.20 | $24,830 | |||
| Green | Neil Adair | 2,932 | 4.94 | +0.17 | $975 | |||
| Independent | John Pacheco | 905 | 1.52 | * | $16,672 | |||
| Canadian Action | Randy Bens | 121 | 0.20 | -0.45 | $620 | |||
| Total valid votes/Expense limit | 59,378 | 100.00 | * | |||||
| 2004 Canadian federal election | ||||||||
|---|---|---|---|---|---|---|---|---|
| Party | Candidate | Votes | % | ±% | ||||
| Liberal | Marlene Catterall | 23,971 | 41.59 | -1.73 | ||||
| Conservative | Sean Casey | 22,591 | 39.20 | -9.20 | ||||
| New Democratic | Marlene Rivier | 7,449 | 12.92 | +7.72 | ||||
| Green | Neil Adair | 2,748 | 4.77 | +3.65 | ||||
| Marijuana | Russell Barth | 430 | 0.75 | -0.06 | ||||
| Canadian Action | Mary-Sue Haliburton | 376 | 0.65 | -0.07 | ||||
| Marxist–Leninist | Alecander Legeais | 68 | 0.12 | * | ||||
| Total valid votes | 57,633 | 100.00 | ||||||
| 2000 Canadian federal election | ||||||||
|---|---|---|---|---|---|---|---|---|
| Party | Candidate | Votes | % | ±% | ||||
| Liberal | Marlene Catterall | 22,607 | 43.32 | -10.69 | ||||
| Alliance | Barry Yeates | 14,753 | 28.27 | +7.04 | ||||
| Progressive Conservative | Tom Curran | 10,506 | 20.13 | +4.59 | ||||
| New Democratic | Kevin Kinsella | 2,718 | 5.21 | -2.41 | ||||
| Green | Matt Takach | 585 | 0.36 | |||||
| Marijuana | Sotos Petrides | 423 | 0.81 | |||||
| Canadian Action | David Creighton | 376 | 0.72 | |||||
| Independent | John Turmel | 89 | 0.17 | -0.22 | ||||
| Communist | Stuart Ryan | 70 | 0.13 | |||||
| Natural Law | Richard Wolfson | 58 | 0.11 | -0.17 | ||||
| Total valid votes | 52,185 | 100.00 | ||||||
| 1997 Canadian federal election | ||||||||
|---|---|---|---|---|---|---|---|---|
| Party | Candidate | Votes | % | |||||
| Liberal | Marlene Catterall | 29,511 | 54.02 | |||||
| Reform | Barry Yeates | 11,601 | 21.23 | |||||
| Progressive Conservative | Margret Kopala | 8,489 | 15.54 | |||||
| New Democratic | Wendy Byrne | 4,163 | 7.62 | |||||
| Green | Stuart Langstaff | 416 | 0.76 | |||||
| Independent | John Turmel | 211 | 0.39 | |||||
| Natural Law | Stan Lamothe | 153 | 0.28 | |||||
| Marxist–Leninist | Marsha Fine | 90 | 0.16 | |||||
| Total valid votes | 54,634 | 100.00 | ||||||
See also
References
- "Ottawa West—Nepean (Code 35066) Census Profile". 2011 census. Government of Canada - Statistics Canada. Retrieved 3 March 2011.
Notes
- Statistics Canada: 2016
- Statistics Canada: 2011
- Government of Canada, Statistics Canada (9 February 2022). "Profile table, Census Profile, 2021 Census of Population - Ottawa West--Nepean [Federal electoral district (2013 Representation Order)], Ontario". www12.statcan.gc.ca. Retrieved 9 March 2023.
- "List of confirmed candidates – September 20, 2021 Federal Election". Elections Canada. Retrieved 2 September 2021.
- Canada, Elections. "Voter Information Service - Find your electoral district". Elections.ca.
- "Election Night Results". Elections Canada. Retrieved 2 November 2019.
- Elections Canada – Confirmed candidates for Ottawa West—Nepean, 30 September 2015
- Elections Canada – Preliminary Election Expenses Limits for Candidates
- Pundits' Guide to Canadian Elections
- "Candidate Campaign Returns : Search for Candidates".
External links
- Website of the Parliament of Canada
- 2011 results from Elections Canada
- Campaign expense data from Elections Canada
- Politwitter
- Project Democracy - includes polling data
- Pundit's Guide - electoral history to present
- StatsCan District Profile
- Ottawa West-Nepean Federal Liberal Association