California's 29th congressional district
California's 29th congressional district is a congressional district in the U.S. state of California based in the north central San Fernando Valley. The district is represented by Democrat Tony Cárdenas.
| California's 29th congressional district | |||
|---|---|---|---|
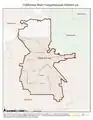
Interactive map of district boundaries since January 3, 2023 | |||
| Representative |
| ||
| Population (2022) | 728,732 | ||
| Median household income | $67,175[1] | ||
| Ethnicity |
| ||
| Cook PVI | D+26[2] | ||
.svg.png.webp)
It includes the city of San Fernando, as well as the Los Angeles communities of Van Nuys, Pacoima, Arleta, Panorama City, Sylmar, and parts of Sun Valley and North Hollywood.
Recent results in statewide elections
| Election results from statewide races | ||
|---|---|---|
| Year | Office | Results |
| 1990 | Governor[3] | Feinstein 74.3%–22.2% |
| 1992 | President[4] | Clinton 66.3%–20.2% |
| Senator[5] | Boxer 67.7%–27.4% | |
| Senator (Special)[6] | Feinstein 72.6%–23.6% | |
| 1994 | Governor[7] | Brown 55.6%–41.1% |
| Senator[8] | Feinstein 69.4%–26.0% | |
| 1996 | President[9] | Clinton 66.5%–23.5% |
| 1998 | Governor[10] | Davis 73.8%–22.6% |
| Senator[11] | Boxer 70.9%–26.7% | |
| 2000 | President[12] | Gore 72.1%–22.3% |
| Senator[13] | Feinstein 70.5%–21.2% | |
| 2002 | Governor[14] | Davis 52.2%–38.7% |
| 2003 | Recall[15][16] | |
| Schwarzenegger 47.1%–33.6% | ||
| 2004 | President[17] | Kerry 61.2%–37.4% |
| Senator[18] | Boxer 63.8%–31.4% | |
| 2006 | Governor[19] | Schwarzenegger 50.3%–44.4% |
| Senator[20] | Feinstein 64.0%–30.7% | |
| 2008 | President[21] | Obama 67.6%–30.4% |
| 2010 | Governor[22] | Brown 61.0%–34.5% |
| Senator[23] | Boxer 60.7%–34.8% | |
| 2012 | President[24] | Obama 77.0%–20.5% |
| Senator[25] | Feinstein 77.8%–22.2% | |
| 2014 | Governor[26] | Brown 73.8%–26.2% |
| 2016 | President[27] | Clinton 77.7%–16.8% |
| Senator[28] | Harris 53.9%–47.0% | |
| 2018 | Governor[29] | Newsom 77.8%–22.2% |
| Senator[30] | Feinstein 55.0%–45.0% | |
| 2020 | President[31] | Biden 74.1%–23.7% |
| 2021 | Recall[32] | |
| 2022 | Governor[33] | Newsom 72.8 - 27.2% |
| Senator | Padilla 76.1 - 23.9% | |
Composition
| # | County | Seat | Population |
|---|---|---|---|
| 37 | Los Angeles | Los Angeles | 9,829,544 |
As of the 2020 redistricting, half of California's 29th congressional district is within Los Angeles County, and half is in northern Los Angeles.
Los Angeles County is split between this district, the 27th district, the 30th district, and the 32nd district. The 29th and 27th are partitioned by Angeles National Forest, Soledad Canyon Road, Southern Pacific Railroad, Sand Canyon Road, Little Tujunga Canyon Road, Santa Clara Truck Trail, Veterans Memorial Park, Golden State Freeway, Devonshire Street, Blue Creek, Chatsworth Street, Balboa Boulevard, Kingsbury Street, Genesta Avenue, Aliso Canyon Wash, and Ronald Reagan Freeway. The 29th and 30th are partitioned by Angeles National Forest, NF-4N35, Gold Creek Road, Big Tujunga Canyon Road, Little Tujunga Road, Longford Street, Clybourne Avenue, Foothill Freeway, Kagel Canyon Street, Osborne Street, Terra Bella Street, Glenoaks Boulevard, Montague Street, San Fernando Road, Branford Street, Tujunga Wash, Wentworth Street, Sheldon Street, Tuxford Street, Sunland Boulevard, Golden State Freeway, Cohasset Street, Sherman Way, Vineland Avenue, Southern Pacific Railroad, Ledge Avenue, West Clark Avenue, North Clybourn Avenue, and the Los Angeles River. The 27th and 32nd are partitioned by San Diego Freeway, Roscoe Boulevard, Reseda Boulevard, Saticoy Street, Lull Street, Garden Grove Avenue, Valerio Street, Etiwanda Avenue, Gault Street, Victory Boulevard, Oxnard Street, Hazeltine Avenue, Burbank Boulevard, Tujunga Wash, Ventura Freeway, Hollywood Freeway, Whipple Street, and Lankershim Boulevard. The 27th district takes in the city of San Fernando and the Los Angeles neighborhoods of Van Nuys, Panorama City, Sylmar, Valley Village, Sun Valley, westside North Hollywood, and central Lake Balboa.
Cities & CDP with 10,000 or more people
- Los Angeles - 3,898,747
- San Fernando - 24,322
List of members representing the district
| Member | Party | Dates | Cong ress(es) |
Electoral history | Counties |
|---|---|---|---|---|---|
| District created January 3, 1953 | |||||
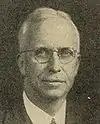 John J. Phillips (Banning) |
Republican | January 3, 1953 – January 3, 1957 |
83rd 84th |
Redistricted from the 22nd district and re-elected in 1952. Re-elected in 1954. Retired. |
1953–1963 Imperial, Riverside |
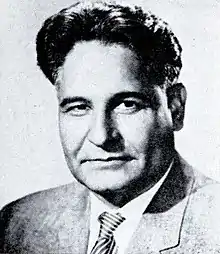 Dalip Singh Saund (Westmoreland) |
Democratic | January 3, 1957 – January 3, 1963 |
85th 86th 87th |
Elected in 1956. Re-elected in 1958. Re-elected in 1960. Redistricted to the 38th district and lost re-election. | |
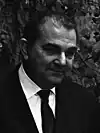 George Brown Jr. (Monterey Park) |
Democratic | January 3, 1963 – January 3, 1971 |
88th 89th 90th 91st |
Elected in 1962. Re-elected in 1964. Re-elected in 1966. Re-elected in 1968. Retired to run for US Senator. |
1963–1969 Los Angeles |
| 1969–1973 Los Angeles | |||||
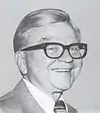 George E. Danielson (Los Angeles) |
Democratic | January 3, 1971 – January 3, 1975 |
92nd 93rd |
Elected in 1970. Re-elected in 1972. Redistricted to the 30th district. | |
| 1973–1975 Los Angeles | |||||
 Augustus Hawkins (Los Angeles) |
Democratic | January 3, 1975 – January 3, 1991 |
94th 95th 96th 97th 98th 99th 100th 101st |
Redistricted from the 21st district and re-elected in 1974. Re-elected in 1976. Re-elected in 1978. Re-elected in 1980. Re-elected in 1982. Re-elected in 1984. Re-elected in 1986. Re-elected in 1988. Retired. |
1975–1983 Los Angeles |
| 1983–1993 South Central Los Angeles | |||||
 Maxine Waters (Los Angeles) |
Democratic | January 3, 1991 – January 3, 1993 |
102nd | Elected in 1990. Redistricted to the 35th district. | |
 Henry Waxman (Los Angeles) |
Democratic | January 3, 1993 – January 3, 2003 |
103rd 104th 105th 106th 107th |
Redistricted from the 24th district and re-elected in 1992. Re-elected in 1994. Re-elected in 1996. Re-elected in 1998. Re-elected in 2000. Redistricted to the 30th district. |
1993–2003 West Side Los Angeles |
_2.jpg.webp) Adam Schiff (Burbank) |
Democratic | January 3, 2003 – January 3, 2013 |
108th 109th 110th 111th 112th |
Redistricted from the 27th district and re-elected in 2002. Re-elected in 2004. Re-elected in 2006. Re-elected in 2008. Re-elected in 2010. Redistricted to the 28th district. |
2003–2013 Los Angeles (Burbank, Glendale, Pasadena) |
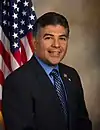 Tony Cárdenas (Los Angeles) |
Democratic | January 3, 2013 – present |
113th 114th 115th 116th 117th 118th |
Elected in 2012. Re-elected in 2014. Re-elected in 2016. Re-elected in 2018. Re-elected in 2020. Re-elected in 2022. Retiring at end of term. |
2013–2023.tif.png.webp) North Central San Fernando Valley |
2023–present_(new_version).svg.png.webp) North Central San Fernando Valley | |||||
Election results
|
1952 • 1954 • 1956 • 1958 • 1960 • 1962 • 1964 • 1966 • 1968 • 1970 • 1972 • 1974 • 1976 • 1978 • 1980 • 1982 • 1984 • 1986 • 1988 • 1990 • 1992 • 1994 • 1996 • 1998 • 2000 • 2002 • 2004 • 2006 • 2010 • 2012 • 2014 • 2016 • 2018 • 2020 • 2022 |
1952
| Party | Candidate | Votes | % | |
|---|---|---|---|---|
| Republican | John J. Phillips (Incumbent) | 73,144 | 100.0 | |
| Republican hold | ||||
1954
| Party | Candidate | Votes | % | |
|---|---|---|---|---|
| Republican | John J. Phillips (Incumbent) | 42,420 | 58.0 | |
| Democratic | Bruce Shangle | 30,781 | 42.0 | |
| Total votes | 73,201 | 100.0 | ||
| Republican hold | ||||
1956
| Party | Candidate | Votes | % | |||
|---|---|---|---|---|---|---|
| Democratic | Dalip Singh Saund | 54,989 | 51.5 | |||
| Republican | Jacqueline Cochran-Odlum | 51,690 | 48.5 | |||
| Total votes | 106,679 | 100.0 | ||||
| Democratic gain from Republican | ||||||
1958
| Party | Candidate | Votes | % | |
|---|---|---|---|---|
| Democratic | Dalip Singh Saund (Incumbent) | 64,518 | 62.4 | |
| Republican | John Babbage | 38,899 | 37.6 | |
| Total votes | 103,417 | 100.0 | ||
| Democratic hold | ||||
1960
| Party | Candidate | Votes | % | |
|---|---|---|---|---|
| Democratic | Dalip Singh Saund (Incumbent) | 76,139 | 57.1 | |
| Republican | Charles H. Jameson | 57,319 | 42.9 | |
| Total votes | 133,458 | 100.0 | ||
| Democratic hold | ||||
1962
| Party | Candidate | Votes | % | |
|---|---|---|---|---|
| Democratic | George Brown, Jr. | 73,740 | 55.7 | |
| Republican | H. L. Richardson, Jr. | 58,760 | 44.3 | |
| Total votes | 132,500 | 100.0 | ||
| Democratic hold | ||||
1964
| Party | Candidate | Votes | % | |
|---|---|---|---|---|
| Democratic | George Brown, Jr. (Incumbent) | 90,208 | 58.6 | |
| Republican | Charles J. Farrington, Jr. | 63,836 | 41.4 | |
| Total votes | 154,044 | 100.0 | ||
| Democratic hold | ||||
1966
| Party | Candidate | Votes | % | |
|---|---|---|---|---|
| Democratic | George Brown, Jr. (Incumbent) | 69,115 | 51.1 | |
| Republican | Bill Orozco | 66,079 | 48.9 | |
| Total votes | 135,194 | 100.0 | ||
| Democratic hold | ||||
1968
| Party | Candidate | Votes | % | |
|---|---|---|---|---|
| Democratic | George Brown, Jr. (Incumbent) | 74,807 | 52.3 | |
| Republican | Bill Orozco | 68,213 | 47.7 | |
| Total votes | 143,020 | 100.0 | ||
| Democratic hold | ||||
1970
| Party | Candidate | Votes | % | |
|---|---|---|---|---|
| Democratic | George E. Danielson | 71,308 | 62.6 | |
| Republican | Tom McMann | 42,620 | 37.4 | |
| Total votes | 113,928 | 100.0 | ||
| Democratic hold | ||||
1972
| Party | Candidate | Votes | % | |
|---|---|---|---|---|
| Democratic | George E. Danielson (Incumbent) | 91,553 | 62.8 | |
| Republican | Richard E. Ferraro | 48,814 | 33.5 | |
| Peace and Freedom | John W. Blaine | 5,455 | 3.7 | |
| Total votes | 145,822 | 100.0 | ||
| Democratic hold | ||||
1974
| Party | Candidate | Votes | % | |
|---|---|---|---|---|
| Democratic | Augustus F. Hawkins (Incumbent) | 45,977 | 100.0 | |
| Democratic hold | ||||
1976
| Party | Candidate | Votes | % | |
|---|---|---|---|---|
| Democratic | Augustus F. Hawkins (Incumbent) | 82,515 | 85.5 | |
| Republican | Michael D. Germonprez | 10,852 | 11.2 | |
| Independent | Sheila Leburg | 3,235 | 3.3 | |
| Total votes | 96,602 | 100.0 | ||
| Democratic hold | ||||
1978
| Party | Candidate | Votes | % | |
|---|---|---|---|---|
| Democratic | Augustus F. Hawkins (Incumbent) | 65,214 | 85.0 | |
| Republican | Uriah J. Fields | 11,512 | 15.0 | |
| Total votes | 76,726 | 100.0 | ||
| Democratic hold | ||||
1980
| Party | Candidate | Votes | % | |
|---|---|---|---|---|
| Democratic | Augustus F. Hawkins (Incumbent) | 80,095 | 86.1 | |
| Republican | Michael Arthur Hirt | 10,282 | 11.1 | |
| Libertarian | Earl Smith | 2,622 | 2.8 | |
| Total votes | 92,999 | 100.0 | ||
| Democratic hold | ||||
1982
| Party | Candidate | Votes | % | |
|---|---|---|---|---|
| Democratic | Augustus F. Hawkins (Incumbent) | 97,028 | 79.8 | |
| Republican | Milton R. Mackaig | 24,568 | 20.2 | |
| Total votes | 121,596 | 100.0 | ||
| Democratic hold | ||||
1984
| Party | Candidate | Votes | % | |
|---|---|---|---|---|
| Democratic | Augustus F. Hawkins (Incumbent) | 108,777 | 86.6 | |
| Republican | Echo Y. Goto | 16,781 | 13.4 | |
| Total votes | 125,558 | 100.0 | ||
| Democratic hold | ||||
1986
| Party | Candidate | Votes | % | |
|---|---|---|---|---|
| Democratic | Augustus F. Hawkins (Incumbent) | 78,132 | 84.6 | |
| Republican | John Van de Brooke | 13,432 | 14.5 | |
| Libertarian | Waheed R. Boctor | 851 | 0.9 | |
| Total votes | 92,415 | 100.0 | ||
| Democratic hold | ||||
1988
| Party | Candidate | Votes | % | |
|---|---|---|---|---|
| Democratic | Augustus F. Hawkins (Incumbent) | 88,169 | 82.8 | |
| Republican | Reuben D. Franco | 14,543 | 13.7 | |
| Libertarian | Gregory P. Gilmore | 3,724 | 3.5 | |
| Total votes | 105,436 | 100.0 | ||
| Democratic hold | ||||
1990
| Party | Candidate | Votes | % | |
|---|---|---|---|---|
| Democratic | Maxine Waters | 51,350 | 79.4 | |
| Republican | Bill DeWitt | 12,054 | 18.6 | |
| Libertarian | Waheed R. Boctor | 1,268 | 2.0 | |
| Total votes | 64,672 | 100.0 | ||
| Democratic hold | ||||
1992
| Party | Candidate | Votes | % | |
|---|---|---|---|---|
| Democratic | Henry Waxman (Incumbent) | 160,312 | 61.3 | |
| Republican | Mark Robbins | 67,141 | 25.7 | |
| Independent | David Davis | 15,445 | 5.9 | |
| Peace and Freedom | Susan C. Davies | 13,888 | 5.3 | |
| Libertarian | Felix Tsvi Rogin | 4,699 | 1.8 | |
| Independent | Vann (write-in) | 1 | 0.0 | |
| Total votes | 261,486 | 100.0 | ||
| Democratic hold | ||||
1994
| Party | Candidate | Votes | % | |
|---|---|---|---|---|
| Democratic | Henry Waxman (Incumbent) | 129,413 | 66.1 | |
| Republican | Paul Stepanek | 53,801 | 28.1 | |
| Libertarian | Mike Binkley | 7,162 | 3.8 | |
| Total votes | 190,376 | 100.0 | ||
| Democratic hold | ||||
1996
| Party | Candidate | Votes | % | |
|---|---|---|---|---|
| Democratic | Henry Waxman (Incumbent) | 145,278 | 67.7 | |
| Republican | Paul Stepanek | 52,857 | 24.6 | |
| Peace and Freedom | John Daley | 8,819 | 4.1 | |
| Libertarian | Mike Binkley | 4,766 | 2.2 | |
| Natural Law | Brian Rees | 3,097 | 1.4 | |
| Total votes | 214,817 | 100.0 | ||
| Democratic hold | ||||
1998
| Party | Candidate | Votes | % | |
|---|---|---|---|---|
| Democratic | Henry Waxman (Incumbent) | 131,561 | 73.9 | |
| Republican | Mike Gottlieb | 40,282 | 22.6 | |
| Libertarian | Mike Binkley | 3,534 | 2.0 | |
| Natural Law | Karen Blasdell-Wilkinson | 2,717 | 1.5 | |
| Total votes | 178,094 | 100.0 | ||
| Democratic hold | ||||
2000
| Party | Candidate | Votes | % | |
|---|---|---|---|---|
| Democratic | Henry Waxman (Incumbent) | 180,295 | 75.7 | |
| Republican | Jim Scileppi | 45,784 | 19.3 | |
| Libertarian | Jack Anderson | 7,944 | 3.3 | |
| Natural Law | Bruce Currivan | 4,178 | 1.7 | |
| Total votes | 238,201 | 100.0 | ||
| Democratic hold | ||||
2002
| Party | Candidate | Votes | % | |
|---|---|---|---|---|
| Democratic | Adam Schiff (Incumbent) | 76,036 | 62.6 | |
| Republican | Jim Scileppi | 40,676 | 33.4 | |
| Libertarian | Ted Brown | 4,889 | 4.0 | |
| Total votes | 121,541 | 100.0 | ||
| Democratic hold | ||||
2004
| Party | Candidate | Votes | % | |
|---|---|---|---|---|
| Democratic | Adam Schiff (Incumbent) | 133,670 | 64.7 | |
| Republican | Harry Frank Scolinos | 62,871 | 30.4 | |
| Green | Philip Koebel | 5,715 | 2.7 | |
| Libertarian | Ted Brown | 4,570 | 2.2 | |
| Independent | John Burton (write-in) | 6 | 0.0 | |
| Total votes | 206,832 | 100.0 | ||
| Democratic hold | ||||
2006
| Party | Candidate | Votes | % | |
|---|---|---|---|---|
| Democratic | Adam Schiff (Incumbent) | 91,014 | 63.5 | |
| Republican | William J. Bodell | 39,321 | 27.5 | |
| Green | William M. Paparian | 8,197 | 5.7 | |
| Peace and Freedom | Lynda L. Llamas | 2,599 | 1.8 | |
| Libertarian | Jim Keller | 2,258 | 1.5 | |
| Independent | John Burton (write-in) | 15 | 0.0 | |
| Total votes | 143,404 | 100.0 | ||
| Democratic hold | ||||
2008
| Party | Candidate | Votes | % | |
|---|---|---|---|---|
| Democratic | Adam Schiff (Incumbent) | 146,198 | 68.9 | |
| Republican | Charles Hahn | 56,727 | 26.7 | |
| Libertarian | Alan Pyeatt | 9,219 | 4.4 | |
| Democratic hold | ||||
2010
| Party | Candidate | Votes | % | |
|---|---|---|---|---|
| Democratic | Adam Schiff (Incumbent) | 104,374 | 64.8 | |
| Republican | John P. Colbert | 51,534 | 32.0 | |
| Libertarian | William P. Cushing | 5,218 | 3.2 | |
| Democratic hold | ||||
2012
| Party | Candidate | Votes | % | |
|---|---|---|---|---|
| Democratic | Tony Cardenas | 111,287 | 74.1 | |
| No party preference | David R. Hernandez | 38,994 | 25.9 | |
| Total votes | 150,281 | 100.0 | ||
| Democratic hold | ||||
2014
| Party | Candidate | Votes | % | |
|---|---|---|---|---|
| Democratic | Tony Cardenas (Incumbent) | 50,096 | 74.6 | |
| Republican | William O'Callaghan Leader | 17,045 | 25.4 | |
| Total votes | 67,141 | 100.0 | ||
| Democratic hold | ||||
2016
| Party | Candidate | Votes | % | |
|---|---|---|---|---|
| Democratic | Tony Cardenas (Incumbent) | 128,407 | 74.7 | |
| Democratic | Richard Alarcon | 43,417 | 25.3 | |
| Total votes | 171,824 | 100.0 | ||
| Democratic hold | ||||
2018
| Party | Candidate | Votes | % | |
|---|---|---|---|---|
| Democratic | Tony Cardenas (Incumbent) | 124,697 | 80.6 | |
| Republican | Benito Benny Bernal | 29,995 | 19.4 | |
| Total votes | 154,692 | 100.0 | ||
| Democratic hold | ||||
2020
| Party | Candidate | Votes | % | |
|---|---|---|---|---|
| Democratic | Tony Cárdenas (incumbent) | 119,420 | 56.6 | |
| Democratic | Angélica Dueñas | 91,524 | 43.4 | |
| Total votes | 210,944 | 100.0 | ||
| Democratic hold | ||||
2022
| Party | Candidate | Votes | % | |
|---|---|---|---|---|
| Democratic | Tony Cárdenas (incumbent) | 69,915 | 58.5 | |
| Democratic | Angélica Dueñas | 49,520 | 41.5 | |
| Total votes | 119,435 | 100.0 | ||
| Democratic hold | ||||
Historical district boundaries
 2013–2023
From 2003 to 2013, the district consisted of parts of northern Los Angeles, including Burbank, Glendale and Pasadena. Due to redistricting after the 2010 United States census, the district shifted northwest within Los Angeles County and includes the northern San Fernando Valley.
References
- US Census
- "2022 Cook PVI: District Map and List". Cook Political Report. Retrieved January 10, 2023.
- Statement of Vote (1990 Governor)
- Statement of Vote (1992 President)
- Statement of Vote (1992 Senate)
- Statement of Vote (1992 Senate)
- Statement of Vote (1994 Governor)
- Statement of Vote (1994 Senate)
- Statement of Vote (1996 President)
- Statement of Vote (1998 Governor) Archived September 29, 2011, at the Wayback Machine
- Statement of Vote (1998 Senate) Archived September 29, 2011, at the Wayback Machine
- Statement of Vote (2000 President)
- Statement of Vote (2000 Senator)
- Statement of Vote (2002 Governor)
- Statement of Vote (2003 Recall Question)
- Statement of Vote (2003 Governor)
- Statement of Vote (2004 President)
- Statement of Vote (2004 Senator)
- Statement of Vote (2006 Governor)
- Statement of Vote (2006 Senator)
- Statement of Vote (2008 President)
- Statement of Vote (2010 Governor)
- Statement of Vote (2010 Senator)
- Statement of Vote (2012 President)
- Statement of Vote (2012 Senator)
- Statement of Vote (2014 Governor)
- Statement of Vote (2016 President)
- Statement of Vote (2016 Senator)
- Statement of Vote (2018 Governor)
- Statement of Vote (2018 Senator)
- "Daily Kos Elections' presidential results by congressional district for 2020, 2016, and 2012".
- Statement of Vote (2021 Governor Recall)
- "Counties by Congressional Districts for Governor" (PDF). sos.ca.gov. November 8, 2022. Retrieved May 4, 2023.
- 1952 election results
- 1954 election results
- 1956 election results
- 1958 election results
- 1960 election results
- 1962 election results
- 1964 election results
- 1966 election results
- 1968 election results
- 1970 election results
- 1972 election results
- 1974 election results
- 1976 election results
- 1978 election results
- 1980 election results
- 1982 election results
- 1984 election results
- 1986 election results
- 1988 election results
- 1990 election results
- 1992 election results
- 1994 election results
- 1996 election results
- 1998 election results
- 2000 election results
- 2002 election results
- 2004 election results
- 2006 election results
- 2008 election results
- 2010 election results
- 2012 election results
- 2014 election results
- 2016 election results
- 2018 election results