Hamilton East—Stoney Creek (federal electoral district)
Hamilton East—Stoney Creek (French: Hamilton-Est—Stoney Creek) is a federal electoral district in Ontario, Canada, that has been represented in the House of Commons of Canada since 2004.
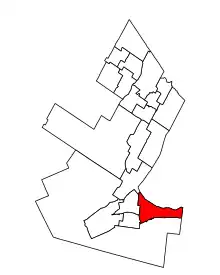 Hamilton East—Stoney Creek in relation to the other Hamilton area ridings | |||
| Federal electoral district | |||
| Legislature | House of Commons | ||
| MP |
Liberal | ||
| District created | 2003 | ||
| First contested | 2004 | ||
| Last contested | 2021 | ||
| District webpage | profile, map | ||
| Demographics | |||
| Population (2011)[1] | 107,786 | ||
| Electors (2015) | 80,042 | ||
| Area (km²)[1] | 72 | ||
| Pop. density (per km²) | 1,497 | ||
| Census division(s) | Hamilton | ||
| Census subdivision(s) | Hamilton | ||
The riding was formed in 2003 from parts of the former ridings of Hamilton East and Stoney Creek.
Of the 115,709 constituents of the riding, a slight majority were previously constituents in the former riding of Stoney Creek. 58,462 constituents were part of the Stoney Creek riding while 57,247 constituents originated from Hamilton East.
This riding lost territory to Hamilton Centre during the 2012 electoral redistribution.
Demographics
- According to the 2021 Canadian census[2]
Languages: 67.6% English, 3.5% Italian, 2.7% Serbian, 2.3% Punjabi, 2.2% Croatian, 1.9% Polish, 1.6% Spanish, 1.5% Arabic, 1.3% Urdu, 1.2% French, 1.1% Portuguese
Religions: 57.5% Christian (33.5% Catholic, 5.1% Christian Orthodox, 3.6% Anglican, 2.8% United Church, 1.5% Presbyterian, 1.0% Pentecostal, 10.0% other), 6.5% Muslim, 2.6% Sikh, 1.8% Hindu, 30.1% none
Median income: $38,800 (2020)
Average income: $47,360 (2020)
| Panethnic group | 2021[3] | 2016[4] | 2011[5] | |||||||||||
|---|---|---|---|---|---|---|---|---|---|---|---|---|---|---|
| Pop. | % | Pop. | % | Pop. | % | |||||||||
| European[lower-alpha 1] | 84,025 | 75.55% | 87,070 | 81.16% | 88,465 | 82.7% | ||||||||
| South Asian | 8,510 | 7.65% | 6,595 | 6.15% | 6,580 | 6.15% | ||||||||
| African | 4,770 | 4.29% | 3,255 | 3.03% | 2,540 | 2.37% | ||||||||
| Southeast Asian[lower-alpha 2] | 3,715 | 3.34% | 2,600 | 2.42% | 2,325 | 2.17% | ||||||||
| Middle Eastern[lower-alpha 3] | 2,885 | 2.59% | 1,630 | 1.52% | 1,285 | 1.2% | ||||||||
| Indigenous | 2,795 | 2.51% | 2,775 | 2.59% | 2,395 | 2.24% | ||||||||
| Latin American | 2,275 | 2.05% | 1,300 | 1.21% | 1,495 | 1.4% | ||||||||
| East Asian[lower-alpha 4] | 1,080 | 0.97% | 1,080 | 1.01% | 1,075 | 1% | ||||||||
| Other/multiracial[lower-alpha 5] | 1,170 | 1.05% | 970 | 0.9% | 810 | 0.76% | ||||||||
| Total responses | 111,220 | 99.28% | 107,280 | 99.47% | 106,975 | 99.25% | ||||||||
| Total population | 112,028 | 100% | 107,848 | 100% | 107,786 | 100% | ||||||||
| Notes: Totals greater than 100% due to multiple origin responses. Demographics based on 2012 Canadian federal electoral redistribution riding boundaries. | ||||||||||||||
Geography
It consists of the part of the City of Hamilton lying north of the Niagara Escarpment and east of Ottawa Street.
The riding consists of the neighbourhoods of, Cherry Heights, Homeside, Normanhurst, McQuesten, Glenview, Rosedale, Red Hill, Vincent, Gershome, Greenford, Corman, Kentley, Riverdale, Parkview West, Parkview East, Nashdale, Lake Grayside and the eastern half of The Delta in the former City of Hamilton plus the part of the former City of Stoney Creek north of the Niagara Escarpment including the "Old Town", Fruitland and Winona.
Member of Parliament
This riding has elected the following members of Parliament:
| Parliament | Years | Member | Party | |
|---|---|---|---|---|
| Hamilton East—Stoney Creek Riding created from Stoney Creek and Hamilton East |
||||
| 38th | 2004–2006 | Tony Valeri | Liberal | |
| 39th | 2006–2008 | Wayne Marston | New Democratic | |
| 40th | 2008–2011 | |||
| 41st | 2011–2015 | |||
| 42nd | 2015–2019 | Bob Bratina | Liberal | |
| 43rd | 2019–2021 | |||
| 44th | 2021–present | Chad Collins | ||
Election results
| 2021 Canadian federal election | ||||||||
|---|---|---|---|---|---|---|---|---|
| Party | Candidate | Votes | % | ±% | Expenditures | |||
| Liberal | Chad Collins | 18,358 | 36.9 | -1.7 | $78,670.69 | |||
| Conservative | Ned Kuruc | 13,934 | 28.0 | +2.8 | $56,327.55 | |||
| New Democratic | Nick Milanovic | 12,748 | 25.6 | -3.0 | $76,637.28 | |||
| People's | Mario Ricci | 3,733 | 7.5 | +5.4 | $6,430.00 | |||
| Green | Larry Pattison | 1,020 | 2.0 | -3.6 | $0.00 | |||
| Total valid votes/expense limit | 49,793 | 99.0 | +0.01 | $114,317.99 | ||||
| Total rejected ballots | 520 | 1.0 | ||||||
| Turnout | 50,313 | 59.3 | ||||||
| Eligible voters | 84,794 | |||||||
| Liberal hold | Swing | -2.3 | ||||||
| Source: Elections Canada[6] | ||||||||
| 2021 federal election redistributed results[7] | |||
|---|---|---|---|
| Party | Vote | % | |
| Liberal | 21,461 | 39.07 | |
| Conservative | 16,546 | 30.12 | |
| New Democratic | 11,910 | 21.68 | |
| People's | 3,986 | 7.26 | |
| Green | 1,022 | 1.86 | |
| 2019 Canadian federal election: Hamilton East—Stoney Creek | ||||||||
|---|---|---|---|---|---|---|---|---|
| Party | Candidate | Votes | % | ±% | Expenditures | |||
| Liberal | Bob Bratina | 20,112 | 38.57 | -0.42 | $70,837.02 | |||
| New Democratic | Nick Milanovic | 14,930 | 28.63 | -4.08 | $64,221.61 | |||
| Conservative | Nikki Kaur | 13,130 | 25.18 | -0.08 | $75,555.96 | |||
| Green | Peter Ormond | 2,902 | 5.57 | +2.97 | $4,130.84 | |||
| People's | Charles Crocker | 1,072 | 2.06 | none listed | ||||
| Total valid votes/expense limit | 52,146 | 98.99 | ||||||
| Total rejected ballots | 533 | 1.01 | +0.43 | |||||
| Turnout | 52,679 | 61.79 | -0.99 | |||||
| Eligible voters | 85,252 | |||||||
| Liberal hold | Swing | +1.83 | ||||||
| Source: Elections Canada[8][9] | ||||||||
| 2015 Canadian federal election | ||||||||
|---|---|---|---|---|---|---|---|---|
| Party | Candidate | Votes | % | ±% | Expenditures | |||
| Liberal | Bob Bratina | 19,622 | 38.99 | +25.41 | $64,967.22 | |||
| New Democratic | Wayne Marston | 16,465 | 32.71 | -11.54 | $69,194.30 | |||
| Conservative | Diane Bubanko | 12,715 | 25.26 | -11.66 | $23,736.31 | |||
| Green | Erin Davis | 1,305 | 2.59 | -0.26 | $1,551.87 | |||
| Communist | Bob Mann | 170 | 0.34 | – | ||||
| Marxist–Leninist | Wendell Fields | 55 | 0.11 | – | ||||
| Total valid votes/expense limit | 50,332 | 99.42 | $215,134.00 | |||||
| Total rejected ballots | 293 | 0.58 | ||||||
| Turnout | 50,625 | 62.78 | ||||||
| Eligible voters | 80,639 | |||||||
| Liberal gain from New Democratic | Swing | +18.48 | ||||||
| Source: Elections Canada[10][11] | ||||||||
| 2011 federal election redistributed results[12] | |||
|---|---|---|---|
| Party | Vote | % | |
| New Democratic | 19,848 | 44.26 | |
| Conservative | 16,557 | 36.92 | |
| Liberal | 6,089 | 13.58 | |
| Green | 1,278 | 2.85 | |
| Others | 1,075 | 2.40 | |
| 2011 Canadian federal election | ||||||||
|---|---|---|---|---|---|---|---|---|
| Party | Candidate | Votes | % | ±% | Expenditures | |||
| New Democratic | Wayne Marston | 21,931 | 45.18 | +3.90 | ||||
| Conservative | Brad Clark | 17,567 | 36.19 | +12.24 | ||||
| Liberal | Michelle Stockwell | 6,411 | 13.21 | -14.67 | ||||
| Green | Dave William Hart Dyke | 1,450 | 2.99 | -1.44 | ||||
| Progressive Canadian | Gord Hill | 486 | 1.00 | -0.76 | ||||
| Libertarian | Greg Pattinson | 385 | 0.79 | – | ||||
| Communist | Bob Mann | 138 | 0.28 | – | ||||
| Marxist–Leninist | Wendell Fields | 95 | 0.20 | – | ||||
| Canadian Action | Bob Green Innes | 92 | 0.19 | – | ||||
| Total valid votes | 48,537 | 100.00 | ||||||
| Total rejected ballots | 368 | 0.75 | +0.11 | |||||
| Turnout | 48,905 | 57.64 | +1.05 | |||||
| Eligible voters | 84,848 | – | – | |||||
| 2008 Canadian federal election | ||||||||
|---|---|---|---|---|---|---|---|---|
| Party | Candidate | Votes | % | ±% | Expenditures | |||
| New Democratic | Wayne Marston | 19,919 | 41.28 | +5.25 | $86,339 | |||
| Liberal | Larry Di Ianni | 13,455 | 27.88 | -7.28 | $65,307 | |||
| Conservative | Frank Rukavina | 11,556 | 23.95 | -1.34 | $89,165 | |||
| Green | David William Hart Dyke | 2,142 | 4.43 | +1.50 | $500 | |||
| Progressive Canadian | Gord Hill | 853 | 1.76 | – | $1,917 | |||
| Independent | Sam Cino | 323 | 0.66 | – | $364 | |||
| Total valid votes/expense limit | 48,143 | 100.00 | $89,236 | |||||
| Total rejected ballots | 311 | 0.64 | ||||||
| Turnout | 48,559 | 56.59 | ||||||
| 2006 Canadian federal election | ||||||||
|---|---|---|---|---|---|---|---|---|
| Party | Candidate | Votes | % | ±% | ||||
| New Democratic | Wayne Marston | 19,346 | 36.03 | +0.19 | ||||
| Liberal | Tony Valeri | 18,880 | 35.16 | -2.58 | ||||
| Conservative | Frank Rukavina | 13,581 | 25.29 | +2.98 | ||||
| Green | Jo Pavlov | 1,573 | 2.93 | -0.03 | ||||
| Communist | Bob Mann | 316 | 0.59 | +0.25 | ||||
| Total valid votes | 53,696 | 100.00 | ||||||
| New Democratic Party gain from Liberal | Swing | -1.4 | ||||||
| 2004 Canadian federal election | ||||||||
|---|---|---|---|---|---|---|---|---|
| Party | Candidate | Votes | % | |||||
| Liberal | Tony Valeri | 18,417 | 37.74 | |||||
| New Democratic | Tony Depaulo | 17,490 | 35.84 | |||||
| Conservative | Fred Eisenberger | 10,888 | 22.31 | |||||
| Green | Richard Safka | 1,446 | 2.96 | |||||
| Independent | Sam Cino | 393 | 0.81 | |||||
| Communist | Bob Mann | 166 | 0.34 | |||||
| Total valid votes | 48,800 | 100.00 | ||||||
See also
References
- "Hamilton East—Stoney Creek (federal electoral district) (Code 35032) Census Profile". 2011 census. Government of Canada - Statistics Canada. Retrieved 3 March 2011.
- Riding history from the Library of Parliament
- 2011 Results from Elections Canada
- Campaign expense data from Elections Canada
Notes
- Statistic includes all persons that did not make up part of a visible minority or an indigenous identity.
- Statistic includes total responses of "Filipino" and "Southeast Asian" under visible minority section on census.
- Statistic includes total responses of "West Asian" and "Arab" under visible minority section on census.
- Statistic includes total responses of "Chinese", "Korean", and "Japanese" under visible minority section on census.
- Statistic includes total responses of "Visible minority, n.i.e." and "Multiple visible minorities" under visible minority section on census.
- Statistics Canada: 2012
- Government of Canada, Statistics Canada (9 February 2022). "Profile table, Census Profile, 2021 Census of Population - Hamilton East--Stoney Creek [Federal electoral district (2013 Representation Order)], Ontario". www12.statcan.gc.ca. Retrieved 9 March 2023.
- Government of Canada, Statistics Canada (26 October 2022). "Census Profile, 2021 Census of Population". www12.statcan.gc.ca. Retrieved 7 April 2024.
- Government of Canada, Statistics Canada (27 October 2021). "Census Profile, 2016 Census". www12.statcan.gc.ca. Retrieved 7 April 2024.
- Government of Canada, Statistics Canada (27 November 2015). "NHS Profile". www12.statcan.gc.ca. Retrieved 7 April 2024.
- "September 20, 2021 General Election Results: Hamilton East—Stoney Creek". Elections Canada. Retrieved 30 December 2021.
- "Transposition of Votes from the 44th General Election to the 2023 Representation Orders". Elections Canada. Retrieved 9 April 2024.
- "List of confirmed candidates". Elections Canada. Retrieved 4 October 2019.
- "Official Voting Results". Elections Canada. Retrieved 12 August 2021.
- Elections Canada – Confirmed candidates for Hamilton East—Stoney Creek, 30 September 2015
- Elections Canada – Preliminary Election Expenses Limits for Candidates
- Pundits' Guide to Canadian Elections
Federal ridings in Hamilton, Halton and Niagara | ||
|---|---|---|
| Liberal |
| .png.webp) |
| Conservative |
| |
| New Democratic | ||