Méjannes-le-Clap
Méjannes-le-Clap (French pronunciation: [meʒan lə klap]; Occitan: Mejanas e lo Clap) is a commune in the Gard department in southern France. It is located 30 km north east of Alès, close to the river Cèze. It is a centre for outdoor activities and environmental tourism.
Méjannes-le-Clap | |
|---|---|
 The Cèze seen from Génèse | |
 Coat of arms | |
Location of Méjannes-le-Clap | |
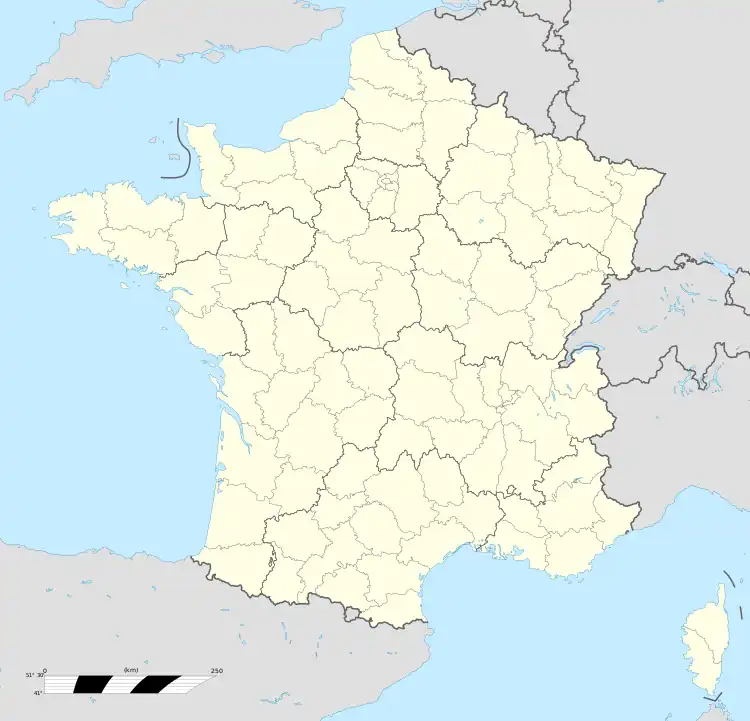 Méjannes-le-Clap 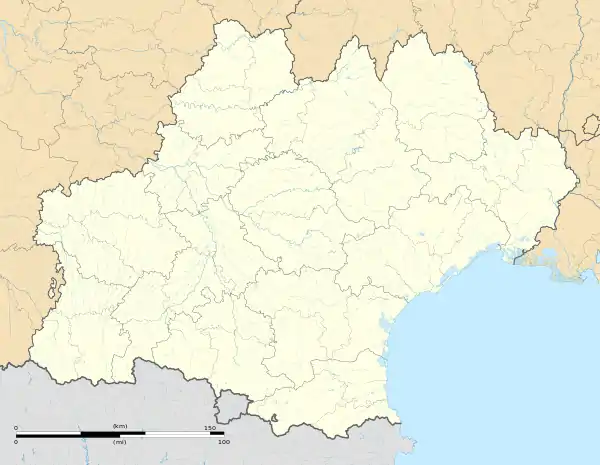 Méjannes-le-Clap | |
| Coordinates: 44°13′34″N 4°20′51″E | |
| Country | France |
| Region | Occitania |
| Department | Gard |
| Arrondissement | Alès |
| Canton | Rousson |
| Government | |
| • Mayor (2020–2026) | Jérôme Bassier[1] |
| Area 1 | 38.24 km2 (14.76 sq mi) |
| Population (2021)[2] | 732 |
| • Density | 19/km2 (50/sq mi) |
| Time zone | UTC+01:00 (CET) |
| • Summer (DST) | UTC+02:00 (CEST) |
| INSEE/Postal code | 30164 /30430 |
| Elevation | 90–474 m (295–1,555 ft) |
| 1 French Land Register data, which excludes lakes, ponds, glaciers > 1 km2 (0.386 sq mi or 247 acres) and river estuaries. | |
Geography
Climate
Méjannes-le-Clap has a hot-summer Mediterranean climate (Köppen climate classification Csa). The average annual temperature in Méjannes-le-Clap is 13.6 °C (56.5 °F). The average annual rainfall is 1,000.8 mm (39.40 in) with October as the wettest month. The temperatures are highest on average in July, at around 23.1 °C (73.6 °F), and lowest in January, at around 5.2 °C (41.4 °F). The highest temperature ever recorded in Méjannes-le-Clap was 42.6 °C (108.7 °F) on 28 June 2019; the coldest temperature ever recorded was −11.7 °C (10.9 °F) on 15 December 2001.
| Climate data for Méjannes-le-Clap (1991−2020 normals, extremes 1992−present) | |||||||||||||
|---|---|---|---|---|---|---|---|---|---|---|---|---|---|
| Month | Jan | Feb | Mar | Apr | May | Jun | Jul | Aug | Sep | Oct | Nov | Dec | Year |
| Record high °C (°F) | 21.0 (69.8) |
24.4 (75.9) |
27.4 (81.3) |
29.1 (84.4) |
34.3 (93.7) |
42.6 (108.7) |
38.1 (100.6) |
41.0 (105.8) |
36.1 (97.0) |
30.2 (86.4) |
23.8 (74.8) |
19.4 (66.9) |
42.6 (108.7) |
| Mean daily maximum °C (°F) | 9.6 (49.3) |
11.2 (52.2) |
15.2 (59.4) |
18.2 (64.8) |
22.5 (72.5) |
27.1 (80.8) |
30.3 (86.5) |
29.8 (85.6) |
24.4 (75.9) |
19.0 (66.2) |
13.4 (56.1) |
10.1 (50.2) |
19.2 (66.6) |
| Daily mean °C (°F) | 5.2 (41.4) |
6.1 (43.0) |
9.4 (48.9) |
12.3 (54.1) |
16.1 (61.0) |
20.3 (68.5) |
23.1 (73.6) |
22.8 (73.0) |
18.4 (65.1) |
14.1 (57.4) |
9.0 (48.2) |
5.9 (42.6) |
13.6 (56.5) |
| Mean daily minimum °C (°F) | 0.8 (33.4) |
1.0 (33.8) |
3.6 (38.5) |
6.4 (43.5) |
9.8 (49.6) |
13.6 (56.5) |
15.9 (60.6) |
15.7 (60.3) |
12.4 (54.3) |
9.3 (48.7) |
4.7 (40.5) |
1.6 (34.9) |
7.9 (46.2) |
| Record low °C (°F) | −11.3 (11.7) |
−11.3 (11.7) |
−10.4 (13.3) |
−4.7 (23.5) |
1.3 (34.3) |
5.5 (41.9) |
7.4 (45.3) |
6.1 (43.0) |
4.4 (39.9) |
−2.6 (27.3) |
−8.1 (17.4) |
−11.7 (10.9) |
−11.7 (10.9) |
| Average precipitation mm (inches) | 83.5 (3.29) |
53.4 (2.10) |
59.0 (2.32) |
80.1 (3.15) |
76.3 (3.00) |
54.5 (2.15) |
42.1 (1.66) |
61.5 (2.42) |
134.6 (5.30) |
139.9 (5.51) |
139.2 (5.48) |
76.7 (3.02) |
1,000.8 (39.40) |
| Average precipitation days (≥ 1.0 mm) | 7.3 | 5.1 | 5.2 | 7.7 | 7.7 | 5.4 | 4.0 | 4.7 | 5.8 | 7.6 | 8.6 | 7.1 | 76.1 |
| Source: Météo-France[3] | |||||||||||||
Population
| Year | Pop. | ±% p.a. |
|---|---|---|
| 1968 | 31 | — |
| 1975 | 34 | +1.33% |
| 1982 | 98 | +16.33% |
| 1990 | 223 | +10.82% |
| 1999 | 304 | +3.50% |
| 2009 | 518 | +5.47% |
| 2014 | 695 | +6.05% |
| 2020 | 725 | +0.71% |
| Source: INSEE[4] | ||
See also
References
- "Répertoire national des élus: les maires". data.gouv.fr, Plateforme ouverte des données publiques françaises (in French). 9 August 2021.
- "Populations légales 2021". The National Institute of Statistics and Economic Studies. 28 December 2023.
- "Fiche Climatologique Statistiques 1991-2020 et records" (PDF) (in French). Météo-France. Retrieved 3 September 2022.
- Population en historique depuis 1968, INSEE