Soumont
Soumont (French pronunciation: [sumɔ̃]; Occitan: Somont) is a commune in the Hérault department in the Occitanie region in southern France.
Soumont | |
|---|---|
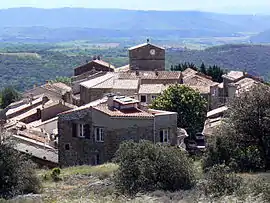 A general view of Soumont | |
Location of Soumont | |
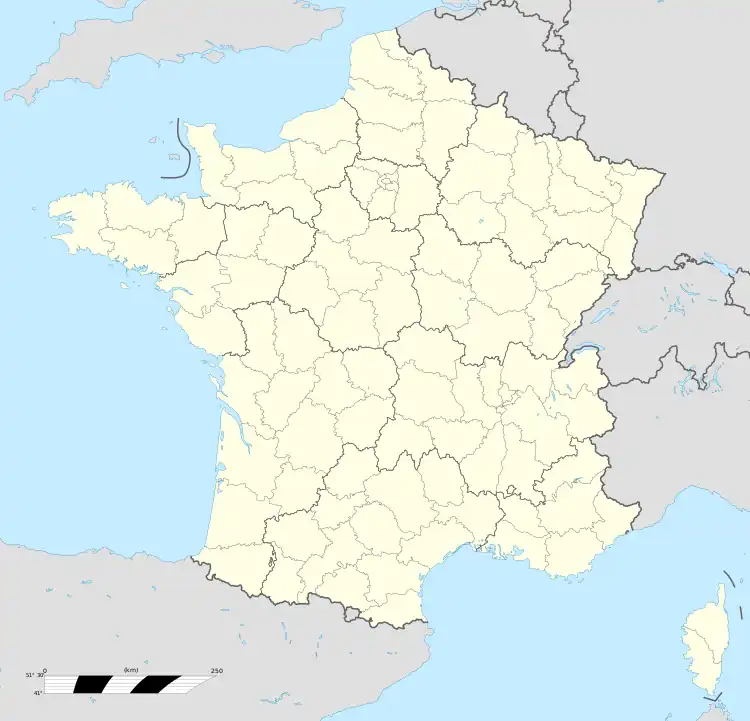 Soumont 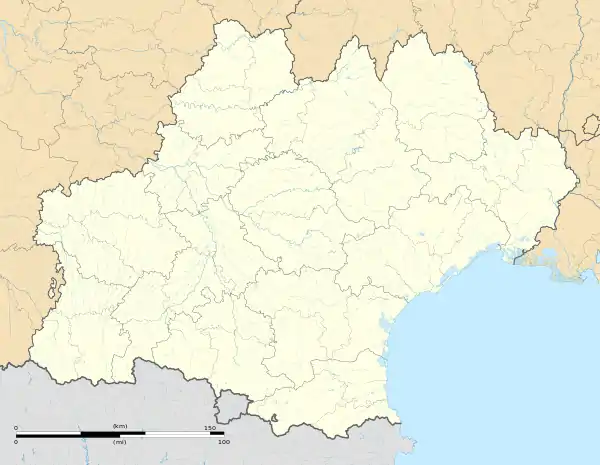 Soumont | |
| Coordinates: 43°43′43″N 3°21′18″E | |
| Country | France |
| Region | Occitania |
| Department | Hérault |
| Arrondissement | Lodève |
| Canton | Lodève |
| Intercommunality | Lodévois - Larzac |
| Government | |
| • Mayor (2020–2026) | Daniel Valette[1] |
| Area 1 | 11.04 km2 (4.26 sq mi) |
| Population (2021)[2] | 221 |
| • Density | 20/km2 (52/sq mi) |
| Time zone | UTC+01:00 (CET) |
| • Summer (DST) | UTC+02:00 (CEST) |
| INSEE/Postal code | 34306 /34700 |
| Elevation | 130–542 m (427–1,778 ft) (avg. 410 m or 1,350 ft) |
| 1 French Land Register data, which excludes lakes, ponds, glaciers > 1 km2 (0.386 sq mi or 247 acres) and river estuaries. | |
Geography
Climate
Soumont has a mediterranean climate (Köppen climate classification Csa). The average annual temperature in Soumont is 14.6 °C (58.3 °F). The average annual rainfall is 981.6 mm (38.65 in) with October as the wettest month. The temperatures are highest on average in July, at around 23.3 °C (73.9 °F), and lowest in January, at around 7.3 °C (45.1 °F). The highest temperature ever recorded in Soumont was 42.6 °C (108.7 °F) on 28 June 2019; the coldest temperature ever recorded was −8.0 °C (17.6 °F) on 5 February 2012.
| Climate data for Soumont (1981–2010 averages, extremes 1991−present) | |||||||||||||
|---|---|---|---|---|---|---|---|---|---|---|---|---|---|
| Month | Jan | Feb | Mar | Apr | May | Jun | Jul | Aug | Sep | Oct | Nov | Dec | Year |
| Record high °C (°F) | 20.9 (69.6) |
23.7 (74.7) |
27.9 (82.2) |
30.9 (87.6) |
34.3 (93.7) |
42.6 (108.7) |
41.5 (106.7) |
40.8 (105.4) |
36.2 (97.2) |
31.5 (88.7) |
24.9 (76.8) |
20.6 (69.1) |
42.6 (108.7) |
| Mean daily maximum °C (°F) | 10.4 (50.7) |
11.4 (52.5) |
14.9 (58.8) |
17.3 (63.1) |
21.7 (71.1) |
26.0 (78.8) |
29.0 (84.2) |
28.8 (83.8) |
23.7 (74.7) |
18.9 (66.0) |
13.7 (56.7) |
10.6 (51.1) |
18.9 (66.0) |
| Daily mean °C (°F) | 7.3 (45.1) |
7.8 (46.0) |
10.6 (51.1) |
12.8 (55.0) |
16.9 (62.4) |
20.7 (69.3) |
23.3 (73.9) |
23.3 (73.9) |
18.9 (66.0) |
15.4 (59.7) |
10.5 (50.9) |
7.7 (45.9) |
14.6 (58.3) |
| Mean daily minimum °C (°F) | 4.2 (39.6) |
4.2 (39.6) |
6.4 (43.5) |
8.4 (47.1) |
12.1 (53.8) |
15.4 (59.7) |
17.7 (63.9) |
17.8 (64.0) |
14.2 (57.6) |
11.9 (53.4) |
7.3 (45.1) |
4.7 (40.5) |
10.4 (50.7) |
| Record low °C (°F) | −6.6 (20.1) |
−8.0 (17.6) |
−6.2 (20.8) |
−0.2 (31.6) |
3.7 (38.7) |
7.8 (46.0) |
10.9 (51.6) |
11.9 (53.4) |
6.8 (44.2) |
−3.0 (26.6) |
−4.6 (23.7) |
−6.5 (20.3) |
−8.0 (17.6) |
| Average precipitation mm (inches) | 103.1 (4.06) |
66.4 (2.61) |
52.2 (2.06) |
90.1 (3.55) |
76.7 (3.02) |
48.9 (1.93) |
29.8 (1.17) |
40.7 (1.60) |
102.4 (4.03) |
142.8 (5.62) |
103.4 (4.07) |
125.1 (4.93) |
981.6 (38.65) |
| Average precipitation days (≥ 1.0 mm) | 8.4 | 6.2 | 5.8 | 8.0 | 8.0 | 5.0 | 3.7 | 4.9 | 6.1 | 9.4 | 7.7 | 7.7 | 80.7 |
| Source: Meteociel[3][4] | |||||||||||||
Population
| Year | Pop. | ±% |
|---|---|---|
| 1962 | 153 | — |
| 1968 | 144 | −5.9% |
| 1975 | 164 | +13.9% |
| 1982 | 130 | −20.7% |
| 1990 | 126 | −3.1% |
| 1999 | 134 | +6.3% |
| 2008 | 135 | +0.7% |
See also
References
- "Répertoire national des élus: les maires". data.gouv.fr, Plateforme ouverte des données publiques françaises (in French). 9 August 2021.
- "Populations légales 2021". The National Institute of Statistics and Economic Studies. 28 December 2023.
- "Normales et records pour Soumont (34)". Meteociel. Retrieved 7 June 2022.
- "Tableau d'observations pour Soumont (34)". www.meteociel.fr. Meteociel. 16 July 2022. Retrieved 17 July 2022.
Wikimedia Commons has media related to Soumont.
This article is issued from Wikipedia. The text is licensed under Creative Commons - Attribution - Sharealike. Additional terms may apply for the media files.