California's 30th congressional district
California's 30th congressional district is a congressional district in the U.S. state of California. The 30th district takes in all of Burbank and Glendale, the Linda Vista neighborhood of Pasadena, and the Los Angeles communities of Tujunga, Hollywood, West Hollywood, Edendale, Park La Brea, Hancock Park, and westside Echo Park. The district is currently represented by Democrat Adam Schiff.
| California's 30th congressional district | |||
|---|---|---|---|
Interactive map of district boundaries since January 3, 2023 | |||
| Representative |
| ||
| Population (2022) | 732,048 | ||
| Median household income | $85,046[1] | ||
| Ethnicity |
| ||
| Cook PVI | D+23[2] | ||
.svg.png.webp)
Recent results in statewide elections
| Election results from statewide races | ||
|---|---|---|
| Year | Office | Results |
| 1990 | Governor[3] | Feinstein 48.0% - 46.7% |
| 1992 | President[4] | Clinton 62.7% - 24.2.7% |
| Senator[5] | Boxer 61.2% - 30.3% | |
| Senator (Special)[6] | Feinstein 66.7% - 20.3% | |
| 1994 | Governor[7] | Brown 59.8% - 36.3% |
| Senator[8] | Feinstein 59.3% - 30.5% | |
| 1996 | President[9] | Clinton 71.0% - 19.8% |
| 1998 | Governor[10] | Davis 77.1% - 18.8% |
| Senator[11] | Boxer 72.7% - 23.5% | |
| 2000 | President[12] | Gore 75.0% - 19.3% |
| Senator[13] | Feinstein 73.2% - 16.5% | |
| 2002 | Governor[14] | Davis 57.1% - 33.3% |
| 2003 | Recall[15][16] | |
| Schwarzenegger 43.5% - 38.7% | ||
| 2004 | President[17] | Kerry 66.1% - 32.8% |
| Senator[18] | Boxer 69.4% - 26.8% | |
| 2006 | Governor[19] | Schwarzenegger 49.8% - 45.9% |
| Senator[20] | Feinstein 71.7% - 29.6% | |
| 2008 | President[21] | Obama 70.4% - 27.9% |
| 2010 | Governor[22] | Brown 62.1% - 24.8% |
| Senator[23] | Boxer 62.8% - 33.8% | |
| 2012 | President[24] | Obama 65.3% - 32.1% |
| Senator[25] | Feinstein 68.6% - 31.4% | |
| 2014 | Governor[26] | Brown 64.3% – 35.7% |
| 2016 | President[27] | Clinton 69.1% - 25.7% |
| Senator[28] | Harris 66.5% - 33.5% | |
| 2018 | Governor[29] | Newsom 69.9% – 30.1% |
| Senator[30] | Feinstein 62.1% – 37.9% | |
| 2020 | President[31] | Biden 68.7% - 29.4% |
| 2021 | Recall[32] | |
| 2022 | Governor[33] | Newsom 75.0 - 25.0% |
| Senator | Padilla 77.0 - 23.0% | |
Composition
| # | County | Seat | Population |
|---|---|---|---|
| 37 | Los Angeles | Los Angeles | 9,829,544 |
As of the 2020 redistricting, California's 30th congressional district is located in Southern California. Two sections of the district are within Los Angeles County, and the other two sections cover parts of northern Los Angeles.
Los Angeles County is split between this district, the 27th district, the 28th district, the 29th district, the 32nd district, the 34th district, the 36th district, and the 37th district. The 30th and 27th are partitioned by Angeles National Forest, B P and L Rd, Mt Emma Rd, BPL Rd, Angeles Forest Highway, NF-3N17, Moody Canyon, NF-4N53, Soledad Canyon Rd, Indian Canyon Rd, and Santa Clarita Divide Rd.
The 30th and 28th are partitioned by Angeles National Forest, Big Tujunga Creek, Big Tujunga Canyon Rd, Silver Creek, Markridge Rd, Pennsylvania Ave, Northwoods Ln, Ramsdell Ave, Fairway Ave, La Crescenta Ave, Mayfield Ave, Rosemont Ave, Florencita Ave, Thompson Ct, Park Pl, Verdugo Blvd, La Tour Way, Descanso Gardens, Norham Pl, Wendover Rd, Linda Vista Ave, Oak Grove Dr, Yucca Ln, W Montana St, Vermont St, Forest Ave, Wyoming St, Lincoln Ave, Anderson Pl, Canada Pl, Highway 210, W Hammond St, Glen Ave, W Mountain St, Manzanita Ave, N Orange Grove Blvd, and Ventura Freeway.
The 30th and 29th are partitioned by Angeles National Forest, NF-4N35, Gold Creek Rd, Big Tujunga Canyon Rd, Little Tujunga Rd, Longford St, Clybourne Ave, Foothill Freeway, Kagel Canyon St, Osborne St, Terra Bella St, Glenoaks Blvd, Montague St, San Fernando Rd, Branford St, Tujunga Wash, Wentworth St, Sheldon St, Tuxford St, Sunland Blvd, Golden State Freeway, Cohasset St, Sherman Way, Vineland Ave, Southern Pacific Railroad, Ledge Ave, W Clark Ave, N Clybourn Ave, and the Los Angeles River.
The 30th and 32nd are partitioned by Lankershim Blvd, Fredonia Dr, Cahuenga Blvd W, Broadlawn Dr, Multiview Dr, Mulholland Dr, Laurel Canyon Blvd, W Sunset Blvd, Ozeta Ter, and Doheny Rd.
The 30th and 34th are partitioned by Crenshaw Blvd, Wilshire Blvd, S Van Ness Ave, S Wilton Pl, N Wilton Pl, Beverly Blvd, N Western Ave, Melrose Ave, Hollywood Freeway, Douglas St, Lilac Ter, N Boylston St, Academy Rd, Pasadena Freeway, Highway 5, Duvall St, Blake Ave, Fernleaf St, Crystal St, Blake Ave, Meadowvale Ave, Los Angeles, Benedict St, N Coolidge Ave, Glendale Freeway, Roswell St, Delay Dr, Fletcher Dr, Southern Pacific Railroad, S Glendale Ave, Vista Superba Dr, Verdugo Rd, Plumas St, Carr Park, Harvey Dr, and Eagle Rock Hilside Park.
The 30th, 36th, and 37th are partitioned by Phyllis Ave, N Doheny Dr, N Oakhurst Dr, Burton Way, N Robertson Blvd, 8733 Clifton Way-201 S Le Doux Rd, N San Vicente Blvd, La Cienga Park, W Olympic Blvd, San Vicente Blvd, S Cochran Ave, Edgewood Pl, S Cloverdale Ave, S La Brea Ave, and S Sycamore Ave.
Cities & CDP with 10,000 or more people
- Los Angeles - 3,898,747
- Glendale - 196,543
- Pasadena - 138,699
- Burbank - 107,337
- West Hollywood - 35,757
List of members representing the district
| Member | Party | Years | Cong ress(es) |
Electoral history | Counties |
|---|---|---|---|---|---|
| District created January 3, 1953 | |||||
.jpg.webp) Bob Wilson (Chula Vista) |
Republican | January 3, 1953 – January 3, 1963 |
83rd 84th 85th 86th 87th |
Elected in 1952. Re-elected in 1954. Re-elected in 1956. Re-elected in 1958. Re-elected in 1960. Redistricted to the 36th district. |
1953–1963 San Diego |
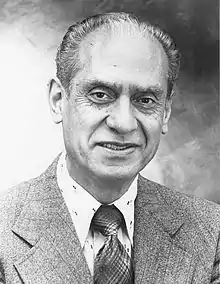 Edward R. Roybal (Los Angeles) |
Democratic | January 3, 1963 – January 3, 1975 |
88th 89th 90th 91st 92nd 93rd |
Elected in 1962. Re-elected in 1964. Re-elected in 1966. Re-elected in 1968. Re-elected in 1970. Re-elected in 1972. Redistricted to the 25th district. |
1963–1969 Los Angeles |
| 1969–1973 Los Angeles | |||||
| 1973–1975 Los Angeles | |||||
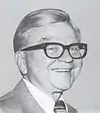 George E. Danielson (Monterey Park) |
Democratic | January 3, 1975 – March 9, 1982 |
94th 95th 96th 97th |
Redistricted from the 29th district and re-elected in 1974. Re-elected in 1976. Re-elected in 1978. Re-elected in 1980. Resigned after being appointed as associate justice on California courts of appeal. |
1975–1983 Los Angeles |
| Vacant | March 9, 1982 – July 13, 1982 |
97th | Special election held July 13, 1982 | ||
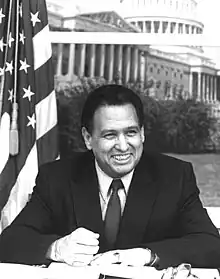 Matthew G. Martínez (Montebello) |
Democratic | July 13, 1982 – January 3, 1993 |
97th 98th 99th 100th 101st 102nd |
Elected to finish Danielson's term. Re-elected in 1982. Re-elected in 1984. Re-elected in 1986. Re-elected in 1988. Re-elected in 1990. Redistricted to the 31st district. | |
| 1983–1993 Los Angeles (San Gabriel Valley) | |||||
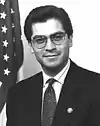 Xavier Becerra (Los Angeles) |
Democratic | January 3, 1993 – January 3, 2003 |
103rd 104th 105th 106th 107th |
Elected in 1992. Re-elected in 1994. Re-elected in 1996. Re-elected in 1998. Re-elected in 2000. Redistricted to the 31st district. |
1993–2003 Central/East/Southeast Los Angeles |
 Henry Waxman (Los Angeles) |
Democratic | January 3, 2003 – January 3, 2013 |
108th 109th 110th 111th 112th |
Redistricted from the 29th district and re-elected in 2002. Re-elected in 2004. Re-elected in 2006. Re-elected in 2008. Re-elected in 2010. Redistricted to the 33rd district. |
2003–2013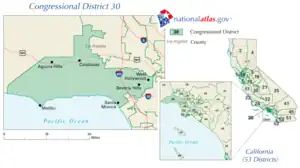 West Side Los Angeles |
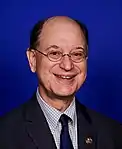 Brad Sherman (Los Angeles) |
Democratic | January 3, 2013 – January 3, 2023 |
113th 114th 115th 116th 117th |
Redistricted from the 27th district and re-elected in 2012. Re-elected in 2014. Re-elected in 2016. Re-elected in 2018. Re-elected in 2020. Redistricted to the 32nd district. |
2013–2023.tif.png.webp) Western San Fernando Valley including Sherman Oaks |
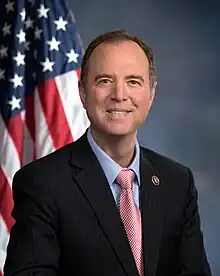 Adam Schiff (Burbank) |
Democratic | January 3, 2023 – present |
118th | Redistricted from the 28th district and re-elected in 2022. Retiring at end of term to run for U.S. senator. |
2023–present:_(new_version).svg.png.webp) West Hollywood, Burbank, parts of Pasadena, Glendale, the Verdugo Hills communities of Sunland and Tujunga, as well as parts of central Los Angeles including Hollywood, the Hollywood Hills, Echo Park, Silver Lake, and Los Feliz |
Election results
|
1952 • 1954 • 1956 • 1958 • 1960 • 1962 • 1964 • 1966 • 1968 • 1970 • 1972 • 1974 • 1976 • 1978 • 1980 • 1982 (Special) • 1982 • 1984 • 1986 • 1988 • 1990 • 1992 • 1994 • 1996 • 1998 • 2000 • 2002 • 2004 • 2006 • 2008 • 2010 • 2012 • 2014 • 2016 • 2018 • 2020 • 2022 |
1952
| Party | Candidate | Votes | % | ||
|---|---|---|---|---|---|
| Republican | Bob Wilson | 121,322 | 59.6 | ||
| Democratic | De Graff Austin | 82,311 | 40.4 | ||
| Total votes | 203,633 | 100.0 | |||
| Republican win (new seat) | |||||
1954
| Party | Candidate | Votes | % | |
|---|---|---|---|---|
| Republican | Bob Wilson (Incumbent) | 94,623 | 60.4 | |
| Democratic | Ross T. McIntire | 61,994 | 39.6 | |
| Total votes | 156,617 | 100.0 | ||
| Republican hold | ||||
1956
| Party | Candidate | Votes | % | |
|---|---|---|---|---|
| Republican | Bob Wilson (Incumbent) | 142,753 | 66.7 | |
| Democratic | George A. Cheney | 71,112 | 33.3 | |
| Total votes | 213,865 | 100.0 | ||
| Republican hold | ||||
1958
| Party | Candidate | Votes | % | |
|---|---|---|---|---|
| Republican | Bob Wilson (Incumbent) | 112,290 | 52.7 | |
| Democratic | Lionel Van Deerlin | 90,641 | 47.3 | |
| Total votes | 202,931 | 100.0 | ||
| Republican hold | ||||
1960
| Party | Candidate | Votes | % | |
|---|---|---|---|---|
| Republican | Bob Wilson (Incumbent) | 158,679 | 59.3 | |
| Democratic | Walter Wencke | 108,882 | 40.7 | |
| Total votes | 267,561 | 100.0 | ||
| Republican hold | ||||
1962
| Party | Candidate | Votes | % | |||
|---|---|---|---|---|---|---|
| Democratic | Edward R. Roybal | 69,008 | 56.5 | |||
| Republican | Gordon L. McDonough (Incumbent) | 53,104 | 43.5 | |||
| Total votes | 122,112 | 100.0 | ||||
| Democratic gain from Republican | ||||||
1964
| Party | Candidate | Votes | % | |
|---|---|---|---|---|
| Democratic | Edward R. Roybal (Incumbent) | 90,329 | 66.3 | |
| Republican | Alfred J. Feder | 45,912 | 33.7 | |
| Total votes | 136,241 | 100.0 | ||
| Democratic hold | ||||
1966
| Party | Candidate | Votes | % | |
|---|---|---|---|---|
| Democratic | Edward R. Roybal (Incumbent) | 72,173 | 66.4 | |
| Republican | Henri O'Bryant Jr. | 36,506 | 33.6 | |
| Total votes | 108,679 | 100.0 | ||
| Democratic hold | ||||
1968
| Party | Candidate | Votes | % | |
|---|---|---|---|---|
| Democratic | Edward R. Roybal (Incumbent) | 75,381 | 67.5 | |
| Republican | Samuel F. Cavnar | 36,312 | 32.5 | |
| Total votes | 111,693 | 100.0 | ||
| Democratic hold | ||||
1970
| Party | Candidate | Votes | % | |
|---|---|---|---|---|
| Democratic | Edward R. Roybal (Incumbent) | 63,903 | 68.3 | |
| Republican | Samuel F. Cavnar | 28,038 | 29.9 | |
| American Independent | Boris Belousov | 1,681 | 1.8 | |
| Total votes | 93,622 | 100.0 | ||
| Democratic hold | ||||
1972
| Party | Candidate | Votes | % | |
|---|---|---|---|---|
| Democratic | Edward R. Roybal (Incumbent) | 76,521 | 68.4 | |
| Republican | Bill Brophy | 32,005 | 28.6 | |
| Peace and Freedom | Lewis McCammon | 3,355 | 3.0 | |
| Total votes | 111,881 | 100.0 | ||
| Democratic hold | ||||
1974
| Party | Candidate | Votes | % | |
|---|---|---|---|---|
| Democratic | George E. Danielson (Incumbent) | 66,074 | 74.2 | |
| Republican | John J. Perez | 22,928 | 25.8 | |
| Total votes | 89,002 | 100.0 | ||
| Democratic hold | ||||
1976
| Party | Candidate | Votes | % | |
|---|---|---|---|---|
| Democratic | George E. Danielson (Incumbent) | 82,767 | 74.4 | |
| Republican | Harry Couch | 28,503 | 25.6 | |
| Total votes | 111,270 | 100.0 | ||
| Democratic hold | ||||
1978
| Party | Candidate | Votes | % | |
|---|---|---|---|---|
| Democratic | George E. Danielson (Incumbent) | 66,241 | 71.4 | |
| Republican | Henry Ares | 26,511 | 28.6 | |
| Total votes | 92,752 | 100.0 | ||
| Democratic hold | ||||
1980
| Party | Candidate | Votes | % | |
|---|---|---|---|---|
| Democratic | George E. Danielson (Incumbent) | 74,119 | 72.1 | |
| Republican | J. Arthur "Art" Platten | 24,136 | 23.5 | |
| Libertarian | Bruce M. Hobbs | 4,480 | 4.4 | |
| Total votes | 102,735 | 100.0 | ||
| Democratic hold | ||||
1982 (Special)
| Party | Candidate | Votes | % | |
|---|---|---|---|---|
| Democratic | Matthew G. Martínez | 14,593 | 51.0 | |
| Republican | Ralph Roy Ramirez | 14,043 | 49.0 | |
| Total votes | 28,636 | 100.0 | ||
| Democratic hold | ||||
1982
| Party | Candidate | Votes | % | |
|---|---|---|---|---|
| Democratic | Matthew G. Martínez (Incumbent) | 60,905 | 53.9 | |
| Republican | John H. Rousselot (Incumbent) | 52,177 | 46.1 | |
| Total votes | 113,082 | 100.0 | ||
| Democratic hold | ||||
1984
| Party | Candidate | Votes | % | |
|---|---|---|---|---|
| Democratic | Matthew G. Martínez (Incumbent) | 64,378 | 51.8 | |
| Republican | Richard Gomez | 53,900 | 43.4 | |
| American Independent | Houston A. Meyers | 6,055 | 4.8 | |
| Total votes | 124,333 | 100.0 | ||
| Democratic hold | ||||
1986
| Party | Candidate | Votes | % | |
|---|---|---|---|---|
| Democratic | Matthew G. Martínez (Incumbent) | 59,369 | 62.5 | |
| Republican | John W. Almquist | 33,705 | 35.5 | |
| Libertarian | Kim J. Goldsworthy | 1,911 | 2.0 | |
| Total votes | 94,985 | 100.0 | ||
| Democratic hold | ||||
1988
| Party | Candidate | Votes | % | |
|---|---|---|---|---|
| Democratic | Matthew G. Martínez (Incumbent) | 72,253 | 59.9 | |
| Republican | Ralph Roy Ramirez | 43,833 | 25.5 | |
| American Independent | Houston A. Myers | 2,694 | 2.2 | |
| Libertarian | Kim J. Goldsworthy | 1,864 | 1.5 | |
| Total votes | 120,644 | 100.0 | ||
| Democratic hold | ||||
1990
| Party | Candidate | Votes | % | |
|---|---|---|---|---|
| Democratic | Matthew G. Martínez (Incumbent) | 45,456 | 58.2 | |
| Republican | Reuben D. Franco | 28,914 | 37.0 | |
| Libertarian | George Curtis Feger | 3,713 | 4.8 | |
| Total votes | 78,083 | 100.0 | ||
| Democratic hold | ||||
1992
| Party | Candidate | Votes | % | |
|---|---|---|---|---|
| Democratic | Xavier Becerra | 48,800 | 58.5 | |
| Republican | Mark Robbins | 20,034 | 25.8 | |
| Green | Blase Bonpane | 6,315 | 7.6 | |
| Peace and Freedom | Elizabeth A. Nakano | 6,173 | 7.4 | |
| Libertarian | Andrew "Drew" Consalvo | 2,221 | 2.7 | |
| Total votes | 83,543 | 100.0 | ||
| Democratic hold | ||||
1994
| Party | Candidate | Votes | % | |
|---|---|---|---|---|
| Democratic | Xavier Becerra (Incumbent) | 43,943 | 66.2 | |
| Republican | David A. Ramirez | 18,741 | 28.2 | |
| Libertarian | R. William Weilberg | 3,741 | 5.6 | |
| Total votes | 66,425 | 100.0 | ||
| Democratic hold | ||||
1996
| Party | Candidate | Votes | % | |
|---|---|---|---|---|
| Democratic | Xavier Becerra (Incumbent) | 58,283 | 72.4 | |
| Republican | Patricia Parker | 15,078 | 18.7 | |
| Libertarian | Pam Probst | 2,759 | 3.4 | |
| Peace and Freedom | Shirley Mandel | 2,499 | 3.1 | |
| Natural Law | Rosemary Watson-Frith | 1,971 | 2.4 | |
| Total votes | 70,590 | 100.0 | ||
| Democratic hold | ||||
1998
| Party | Candidate | Votes | % | |
|---|---|---|---|---|
| Democratic | Xavier Becerra (Incumbent) | 58,230 | 81.2 | |
| Republican | Patricia Parker | 13,441 | 18.8 | |
| Total votes | 71,671 | 100.0 | ||
| Democratic hold | ||||
2000
| Party | Candidate | Votes | % | |
|---|---|---|---|---|
| Democratic | Xavier Becerra (Incumbent) | 83,223 | 83.3 | |
| Republican | Tony Goss | 11,788 | 11.8 | |
| Libertarian | Jason E. Heath | 2,858 | 2.9 | |
| Natural Law | Gary D. Hearne | 2,051 | 2.0 | |
| Total votes | 99,920 | 100.0 | ||
| Democratic hold | ||||
2002
| Party | Candidate | Votes | % | |
|---|---|---|---|---|
| Democratic | Henry Waxman (Incumbent) | 130,604 | 70.4 | |
| Republican | Tony D. Goss | 54,989 | 29.6 | |
| Total votes | 185,593 | 100.0 | ||
| Democratic hold | ||||
2004
| Party | Candidate | Votes | % | |
|---|---|---|---|---|
| Democratic | Henry Waxman (Incumbent) | 216,682 | 71.3 | |
| Republican | Victor Elizalde | 87,465 | 28.7 | |
| Total votes | 313,147 | 100.0 | ||
| Democratic hold | ||||
2006
| Party | Candidate | Votes | % | |
|---|---|---|---|---|
| Democratic | Henry Waxman (Incumbent) | 151,284 | 71.5 | |
| Republican | David Nelson Jones | 55,904 | 26.4 | |
| Peace and Freedom | Adele M. Cannon | 4,546 | 2.1 | |
| Total votes | 211,734 | 100.0 | ||
| Democratic hold | ||||
2008
| Party | Candidate | Votes | % | |
|---|---|---|---|---|
| Democratic | Henry Waxman (Incumbent) | 242,792 | 100.0 | |
| Democratic hold | ||||
2010
| Party | Candidate | Votes | % | |
|---|---|---|---|---|
| Democratic | Henry Waxman (Incumbent) | 153,663 | 64.7 | |
| Republican | Charles E. Wilkerson | 75,948 | 31.9 | |
| Libertarian | Erich D. Miller | 5,021 | 2.1 | |
| Peace and Freedom | Richard R. Castaldo | 3,115 | 1.3 | |
| Total votes | 237,747 | 100.0 | ||
| Democratic hold | ||||
2012
| Party | Candidate | Votes | % | |
|---|---|---|---|---|
| Democratic | Brad Sherman (Incumbent) | 149,456 | 60.3 | |
| Democratic | Howard Berman (incumbent) | 98,395 | 39.7 | |
| Total votes | 247,851 | 100.0 | ||
| Democratic hold | ||||
2014
| Party | Candidate | Votes | % | |
|---|---|---|---|---|
| Democratic | Brad Sherman (Incumbent) | 86,568 | 65.6 | |
| Republican | Mark S. Reed | 45,315 | 34.4 | |
| Total votes | 131,883 | 100% | ||
| Democratic hold | ||||
2016
| Party | Candidate | Votes | % | |
|---|---|---|---|---|
| Democratic | Brad Sherman (Incumbent) | 205,279 | 72.6 | |
| Republican | Mark S. Reed | 77,325 | 27.4 | |
| Total votes | 282,604 | 100.0 | ||
| Democratic hold | ||||
2018
| Party | Candidate | Votes | % | |
|---|---|---|---|---|
| Democratic | Brad Sherman (Incumbent) | 191,573 | 73.4 | |
| Republican | Mark S. Reed | 69,420 | 26.6 | |
| Total votes | 260,993 | 100.0 | ||
| Democratic hold | ||||
2020
| Party | Candidate | Votes | % | |
|---|---|---|---|---|
| Democratic | Brad Sherman (incumbent) | 240,038 | 69.5 | |
| Republican | Mark S. Reed | 105,426 | 30.5 | |
| Total votes | 345,464 | 100.0 | ||
| Democratic hold | ||||
2022
| Party | Candidate | Votes | % | |
|---|---|---|---|---|
| Democratic | Adam Schiff (incumbent) | 150,100 | 71.1 | |
| Democratic | G "Maebe A. Girl" Pudlo | 60,968 | 28.9 | |
| Total votes | 211,068 | 100.0 | ||
| Democratic hold | ||||
Historical district boundaries
Before the 2013 redistricting resulting from the 2010 United States census and the 2012 elections, the western Los Angeles County district was represented by Democrat Henry A. Waxman. From 2003 to 2013 the district included many of the cities and suburbs of western Greater Los Angeles, most notably Hollywood, West Hollywood, Beverly Hills, Santa Monica, Pacific Palisades, Malibu and Topanga, Calabasas, Agoura Hills, Woodland Hills.
References
- US Census
- "2022 Cook PVI: District Map and List". Cook Political Report. Retrieved January 10, 2023.
- Statement of Vote (1990 Governor)
- Statement of Vote (1992 President)
- Statement of Vote (1992 Senate)
- Statement of Vote (1992 Senate)
- Statement of Vote (1994 Governor)
- Statement of Vote (1994 Senate)
- Statement of Vote (1996 President)
- Statement of Vote (1998 Governor) Archived September 29, 2011, at the Wayback Machine
- Statement of Vote (1998 Senate) Archived September 29, 2011, at the Wayback Machine
- Statement of Vote (2000 President)
- Statement of Vote (2000 Senator)
- Statement of Vote (2002 Governor)
- Statement of Vote (2003 Recall Question)
- Statement of Vote (2003 Governor)
- Statement of Vote (2004 President)
- Statement of Vote (2004 Senator)
- Statement of Vote (2006 Governor)
- Statement of Vote (2006 Senator)
- Statement of Vote (2008 President)
- Statement of Vote (2010 Governor)
- Statement of Vote (2010 Senator)
- Statement of Vote (2012 President)
- Statement of Vote (2012 Senator)
- Statement of Vote (2014 Governor)
- Statement of Vote (2016 President)
- Statement of Vote (2016 Senator)
- Statement of Vote (2018 Governor)
- Statement of Vote (2018 Senator)
- "Daily Kos Elections' presidential results by congressional district for 2020, 2016, and 2012".
- "Counties by Congressional District for Recall Question" (PDF). sos.ca.gov. September 14, 2021. Retrieved May 2, 2022.
- "Counties by Congressional Districts for Governor" (PDF). sos.ca.gov. November 8, 2022. Retrieved May 4, 2023.
- 1952 election results
- 1954 election results
- 1956 election results
- 1958 election results
- 1960 election results
- 1962 election results
- 1964 election results
- 1966 election results
- 1968 election results
- 1970 election results
- 1972 election results
- 1974 election results
- 1976 election results
- 1978 election results
- 1980 election results
- 1982 special election results
- 1982 election results
- 1984 election results
- 1986 election results
- 1988 election results
- 1990 election results
- 1992 election results
- 1994 election results
- 1996 election results
- 1998 election results
- 2000 election results
- 2002 election results
- 2004 election results
- 2006 election results
- 2008 election results
- 2010 election results
- 2012 election results
- 2014 election results
- 2016 election results
- 2018 election results