1935 Alberta general election
The 1935 Alberta general election was held on August 22, 1935, to elect members of the Legislative Assembly of Alberta. The newly founded Social Credit Party of Alberta won a sweeping victory, unseating the 14-year government of the United Farmers of Alberta. It was one of only five times that Alberta has changed governments.
| |||||||||||||||||||||||||||||||||||||||||||||||||||||||||||||||||||||||||||||||||||||||||
63 seats in the Legislative Assembly of Alberta 32 seats were needed for a majority | |||||||||||||||||||||||||||||||||||||||||||||||||||||||||||||||||||||||||||||||||||||||||
|---|---|---|---|---|---|---|---|---|---|---|---|---|---|---|---|---|---|---|---|---|---|---|---|---|---|---|---|---|---|---|---|---|---|---|---|---|---|---|---|---|---|---|---|---|---|---|---|---|---|---|---|---|---|---|---|---|---|---|---|---|---|---|---|---|---|---|---|---|---|---|---|---|---|---|---|---|---|---|---|---|---|---|---|---|---|---|---|---|---|
| Turnout | 81.8% | ||||||||||||||||||||||||||||||||||||||||||||||||||||||||||||||||||||||||||||||||||||||||
| |||||||||||||||||||||||||||||||||||||||||||||||||||||||||||||||||||||||||||||||||||||||||
| |||||||||||||||||||||||||||||||||||||||||||||||||||||||||||||||||||||||||||||||||||||||||
.jpg.webp)
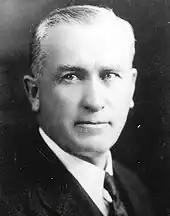
Premier John E. Brownlee had resigned on July 10, 1934, when he was sued and found liable for the seduction of a young clerk working in the Attorney-General's office. Although the verdict was immediately set aside by the presiding judge, the scandal seriously damaged the UFA's reputation among socially conservative Albertans. Provincial Treasurer Richard G. Reid succeeded him, but was unable to change the party's fortunes. The government had fallen into disfavour as it had proven unable to address the Depression, which had hit Alberta particularly hard, and due to the government's unwillingness to accede to demands to adopt Social Credit policies and programs.
Social Credit won 56 of the 63 seats in the legislature, and over 50% of the popular vote, well beyond even the most optimistic Socred projections. Many of those gains came at the expense of the UFA, which lost all of its seats in one of the worst defeats ever suffered by a provincial government in Canada. Reid and Brownlee, for instance, were heavily defeated by Socred challengers, with Reid being pushed into third place. The UFA did receive 11 percent of the vote so its due share was about ten members - the province's limited use of PR did not ensure that it won any seats at all.
The UFA's wipeout happened just a month after the Prince Edward Island Tories lost all 18 of their seats at that year's provincial election. A similar wipeout would not happen again until the 1987 New Brunswick general election, when the governing New Brunswick Tories lost all 39 of their seats.
The Alberta Liberals in this election ran with the tactically fatal slogan, the "rest of Canada can't be wrong"—referring to the popularity of the Liberal Party in the rest of the country. It did not work; they had their seat count cut in half. However, due to the UFA being swept from the legislature, the Liberals wound up as the Official Opposition. The Conservatives lost four of their six seats.
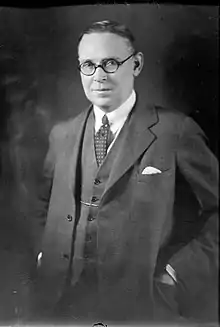
The Socreds' expectations for the election had been so low that they had not even named a formal leader for the campaign. When the newly elected Socred MLAs held their first caucus meeting, the first order of business was to select a leader and premier-designate. The obvious choice was the party's founder and guiding force, Calgary-based Baptist pastor William Aberhart. Persuaded to accept the mantle of leadership, Aberhart was sworn in as premier on September 3.
This provincial election, like the previous two, saw district-level proportional representation (Single transferable voting) used to elect the MLAs of Edmonton and Calgary. City-wide districts were used to elect multiple MLAs in the cities. All the other MLAs were elected in single-member districts through Instant-runoff voting.
The turnout of the 1935 election topped 80%, and no election in Alberta has come close to this mark.
This election campaign is seen as the most negative in Alberta's history, with reports of Social Credit members, operating openly and on Aberhart's directives, defacing the campaign signs of opponents and drowning their speeches by honking car horns. Many campaign ads also focused mostly on attacking the opposing parties.
After the 1935 election results were in, newspapers across North America took notice, with the Boston Herald running the headline "Alberta Goes Crazy!".[1]
This shift marked the first in Social Credit's nine consecutive election victories, for a total of 36 years in office–one of the longest unbroken runs in government in the Commonwealth. The UFA never recovered from this wipeout defeat, withdrawing from politics altogether in 1937. Many of UFA's erstwhile supporters shifted to supporting the CCF, whose full name "CCF (Farmer-Labour-Socialist)" indicates how it was a merging of UFA and other previous farmer and labor parties.
Results
| Party | Leader | Candidates | First-preference votes | Seats | ||||||||
|---|---|---|---|---|---|---|---|---|---|---|---|---|
| Votes | ± | % Fpv | Change (pp) | 1930 | 1935 | ± | ||||||
| Social Credit | William Aberhart | 63 | 163,700 | 163,700 | 54.25 | 54.25 | – | 56 / 63 |
56 | |||
| United Farmers | Richard G. Reid | 45 | 33,063 | 41,124 | 11.00 | -28.41 | 39 | 0 / 63 |
39 | |||
| Liberal | William R. Howson | 61 | 69,845 | 23,570 | 23.14 | -1.45 | 11 | 5 / 63 |
6 | |||
| Conservative | David M. Duggan | 39 | 19,358 | 8,596 | 6.41 | -8.44 | 6 | 2 / 63 |
4 | |||
| Labour | Fred J. White | 11 | 5,086 | 9,268 | 1.68 | -5.95 | 4 | 0 / 63 |
4 | |||
| Independent | 7 | 2,740 | 20,526 | 0.90 | -11.46 | 3 | 0 / 63 |
3 | ||||
| Communist | Jan Lakeman | 9 | 5,771 | 3,588 | 1.91 | 0.75 | ||||||
| Independent Liberal | 1 | 955 | 955 | 0.31 | ||||||||
| United Front | 1 | 560 | 560 | 0.19 | ||||||||
| Independent Conservative | 1 | 258 | 258 | 0.08 | ||||||||
| Independent Labour | 1 | 224 | 224 | 0.07 | ||||||||
| Reconstruction | 1 | 192 | 192 | 0.06 | ||||||||
| Total | 240 | 301,752 | 100.00% | |||||||||
| Rejected ballots | 8,269 | 562 | ||||||||||
| Turnout | 310,021 | 114,095 |
81.8% | 15.1 | ||||||||
| Registered voters | 378,249 | 84,454 | ||||||||||
MLAs elected
|
Acadia: Norman James
Alexandra: Selmer Berg
Athabasca: Clarence Tade
Beaver River: Lucien Maynard
Bow Valley: Wilson Cain
Camrose: William Chant
Clover Bar: Floyd Baker
Cochrane: William King
Coronation: Glenville MacLachlan
Cypress: August Flamme
Didsbury: Edward P. Foster
Drumheller: Herbert Ingrey
|
Edson: Joseph Unwin
Empress: David Lush
Gleichen: Isaac McCune
Grande Prairie: William Sharpe
Grouard: Leonidas Giroux
Hand Hills: Wallace Warren Cross
Innisfail: Alban MacLellan
Lac Ste. Anne: Albert Bourcier
Lacombe: Duncan MacMillan
Leduc: Ronald Ansley
Lethbridge: Hans Wight
Macleod: James Hartley
Medicine Hat: John Lyle Robinson
Nanton-Claresholm: Harry Haslam
Okotoks-High River: William Morrison
Olds: Herbert Ash |
Pembina: Harry Knowlton Brown
Pincher Creek: Roy Taylor
Red Deer: Alfred Hooke
Ribstone: Albert Blue
Rocky Mountain: Ernest Duke
St. Paul: Joseph Beaudry
Sedgewick: Albert Fee
Stettler: Charles Cockroft
Sturgeon: James Popil
Taber: James Hansen
Vegreville: James McPherson
Vermilion: William Fallow
Victoria: Samuel Calvert
Wainwright: William Masson
Warner: Solon Low
Wetaskiwin: John Wingblade
Whitford: Isidore Goresky
|
Synopsis of results
| Riding | First-preference votes | Turnout [a 1] |
Final counts | Winning party | |||||||||||||
|---|---|---|---|---|---|---|---|---|---|---|---|---|---|---|---|---|---|
| Name | SC | UFA | Lib | Con | Lab | Comm | Ind | Total | SC | UFA | Lib | I-Lib | 1930 | 1935 | |||
| Acadia | 1,834 | 628 | 289 | – | – | – | – | 2,751 | 90.3% | Elected on 1st count | UFA | SC | |||||
| Alexandra | 2,479 | 924 | 561 | 202 | – | 197 | – | 4,363 | 78.3% | Elected on 1st count | UFA | SC | |||||
| Athabasca | 1,764 | – | 950 | 315 | – | – | – | 3,029 | 71.0% | Elected on 1st count | Lib | SC | |||||
| Beaver River | 1,751 | 572 | 775 | 147 | – | – | – | 3,245 | 66.8% | Elected on 1st count | Lib | SC | |||||
| Bow Valley | 1,776 | 401 | 591 | – | – | – | 204 | 2,972 | 85.9% | Elected on 1st count | Ind | SC | |||||
| Camrose | 4,335 | 1,039 | 1,395 | – | – | – | – | 6,769 | 86.7% | Elected on 1st count | UFA | SC | |||||
| Cardston | 2,027 | 565 | 471 | – | – | – | – | 3,063 | 95.4% | Elected on 1st count | UFA | SC | |||||
| Clover Bar | 2,503 | 844 | 1,105 | 264 | – | – | – | 4,716 | 86.0% | Elected on 1st count | UFA | SC | |||||
| Cochrane | 1,880 | 591 | 628 | 337 | – | – | – | 3,436 | 87.9% | Elected on 1st count | UFA | SC | |||||
| Coronation | 2,674 | 844 | 625 | – | – | – | – | 4,143 | 87.4% | Elected on 1st count | UFA | SC | |||||
| Cypress | 1,689 | 587 | 798 | – | – | – | 51 | 3,125 | 83.0% | Elected on 1st count | UFA | SC | |||||
| Didsbury | 2,731 | 610 | 607 | 303 | – | – | – | 4,251 | 85.0% | Elected on 1st count | UFA | SC | |||||
| Drumheller | 2,158 | – | 341 | – | – | 342 | 778 | 3,619 | 84.4% | Elected on 1st count | Ind | SC | |||||
| Edson | 2,154 | – | 1,620[a 2] | – | 1,414 | – | – | 5,188 | 76.0% | 2,443 | – | 2,068 | – | Lab | SC | ||
| Empress | 1,453 | 324 | 239 | – | – | – | – | 2,016 | 84.5% | Elected on 1st count | UFA | SC | |||||
| Gleichen | 2,093 | 895 | 569 | 439 | – | – | – | 3,996 | 84.3% | Elected on 1st count | UFA | SC | |||||
| Grande Prairie | 2,741 | 1,809 | 2,387 | 464 | – | – | – | 7,401 | 75.6% | 3,142 | – | 3,061 | – | UFA | SC | ||
| Grouard | 1,447 | 346 | 2,272 | – | – | – | – | 4,065 | 78.1% | Elected on 1st count | Lib | Lib | |||||
| Hand Hills | 3,270 | 707 | 552 | – | – | – | – | 4,529 | 86.5% | Elected on 1st count | UFA | SC | |||||
| Innisfail | 2,805 | 386 | 583 | 318 | – | – | – | 4,092 | 87.5% | Elected on 1st count | UFA | SC | |||||
| Lac Ste. Anne | 1,668 | 1,080 | 897 | 133 | – | – | – | 3,778 | 75.6% | 1,791 | 1,518 | – | – | UFA | SC | ||
| Lacombe | 3,483 | 721 | 838 | 519 | – | – | – | 5,561 | 86.6% | Elected on 1st count | UFA | SC | |||||
| Leduc | 2,940 | 357 | 1,305 | 166 | – | – | – | 4,768 | 82.0% | Elected on 1st count | Lib | SC | |||||
| Lethbridge | 3,700 | – | 1,946 | 341 | 654 | – | – | 6,641 | 81.6% | Elected on 1st count | Lab | SC | |||||
| Little Bow | 2,322 | 704 | 474 | – | – | – | – | 3,500 | 87.9% | Elected on 1st count | UFA | SC | |||||
| Macleod | 1,680 | 650 | 387 | – | – | – | – | 2,717 | 86.1% | Elected on 1st count | UFA | SC | |||||
| Medicine Hat | 3,236 | – | 1,252 | 653 | – | – | – | 5,141 | 83.3% | Elected on 1st count | Lib | SC | |||||
| Nanton-Claresholm | 1,767 | 612 | 512 | 269 | – | – | – | 3,165 | 86.3% | Elected on 1st count | UFA | SC | |||||
| Okotoks-High River | 3,062 | 1,005 | 970 | 452 | – | – | – | 5,489 | 85.8% | Elected on 1st count | UFA | SC | |||||
| Olds | 3,538 | 694 | 955 | 167 | – | – | – | 5,354 | 91.6% | Elected on 1st count | UFA | SC | |||||
| Peace River | 2,474 | 994 | 1,389 | 308 | – | – | – | 5,165 | 69.6% | 2,269 | – | 1,898 | – | UFA | SC | ||
| Pembina | 3,133 | 1,030 | 1,145 | 183 | – | – | – | 5,491 | 80.1% | Elected on 1st count | UFA | SC | |||||
| Pincher Creek | 1,214 | 296 | 528 | 312 | – | – | – | 2,350 | 88.4% | Elected on 1st count | Lib | SC | |||||
| Ponoka | 2,295 | 879 | 696 | – | – | – | – | 3,870 | 86.6% | Elected on 1st count | UFA | SC | |||||
| Red Deer | 3,565 | – | 788 | 612 | – | 291 | 622 | 5,878 | 85.6% | Elected on 1st count | UFA | SC | |||||
| Ribstone | 2,684 | 499 | 589 | – | – | – | – | 3,772 | 87.3% | Elected on 1st count | UFA | SC | |||||
| Rocky Mountain | 2,996 | – | 1,033 | – | – | 1,080 | 389 | 5,498 | 82.0% | Elected on 1st count | Ind | SC | |||||
| St. Albert | 1,431 | 116 | 446 | – | – | – | 1,253[a 3] | 3,206 | 86.4% | 1,619 | – | – | 1,445 | UFA | SC | ||
| St. Paul | 2,567 | 946 | 1,963 | – | – | – | – | 5,476 | 82.2% | 2,679 | – | 2,364 | – | Lib | SC | ||
| Sedgewick | 3,642 | 933 | 632 | – | – | – | – | 5,107 | 88.7% | Elected on 1st count | UFA | SC | |||||
| Stettler | 3,603 | 522 | 882 | 271 | – | – | – | 5,278 | 89.9% | Elected on 1st count | UFA | SC | |||||
| Stony Plain | 2,832 | 312 | 1,472 | 171 | – | – | – | 4,787 | 82.8% | Elected on 1st count | UFA | SC | |||||
| Sturgeon | 2,465 | 857 | 1,533 | 361 | – | – | 560 | 5,776 | 80.8% | 2,729 | – | 2,053 | – | UFA | SC | ||
| Taber | 2,879 | 757 | 642 | – | – | – | – | 4,278 | 79.9% | Elected on 1st count | UFA | SC | |||||
| Vegreville | 2,817 | 995 | 1,681 | 109 | – | – | – | 5,602 | 82.5% | 3,047 | – | 2,065 | – | UFA | SC | ||
| Vermilion | 2,452 | 876 | 1,062 | 244 | – | 838 | – | 5,472 | 82.8% | 2,664 | – | 1,437 | – | UFA | SC | ||
| Victoria | 2,045 | 319 | 1,181 | 141 | – | – | – | 3,686 | 77.8% | Elected on 1st count | UFA | SC | |||||
| Wainwright | 2,382 | 811 | 953 | 194 | – | – | – | 4,340 | 83.6% | Elected on 1st count | UFA | SC | |||||
| Warner | 1,702 | 588 | 534 | – | – | – | 227 | 3,051 | 82.7% | Elected on 1st count | UFA | SC | |||||
| Wetaskiwin | 2,762 | 506 | 1,149 | 187 | – | 141 | – | 4,745 | 85.7% | Elected on 1st count | Lib | SC | |||||
| Whitford | 1,265 | 940 | 615 | – | – | 966 | – | 3,786 | 77.8% | 1,370 | 1,121 | – | – | UFA | SC | ||
- including spoilt ballots
- John Sedgwick Cowper was previously a member of the Legislative Assembly of British Columbia.
- Lucien Boudreau (Ind-Liberal) - 955 votes; A.S. McRae (Ind-Conservative) - 258 votes.
- = Open seat
- = turnout is above provincial average
- = Candidate was in previous Legislature
- = Incumbent had switched allegiance
- = Previously incumbent in another riding
- = Not incumbent; was previously elected to the Legislature
- = Incumbency arose from by-election gain
- = previously an MP in the House of Commons of Canada
- = Multiple candidates
STV analysis
Exhausted votes
Twelve districts went beyond first-preference counts in order to determine winning candidates:
| District | Counts | Exhausted | |||
|---|---|---|---|---|---|
| 1st preference | Final | Votes | % of 1st pref | ||
| Calgary | 41,193 | 37,827 | 3,366 | 8.17 | |
| Edmonton | 37,267 | 35,625 | 1,642 | 4.41 | |
| Edson | 5,188 | 4,511 | 677 | 13.05 | |
| Grande Prairie | 7,401 | 6,203 | 1,198 | 16.19 | |
| Lac Ste. Anne | 3,778 | 3,309 | 469 | 12.41 | |
| Peace River | 5,165 | 4,167 | 998 | 19.32 | |
| St. Albert | 3,206 | 3,064 | 142 | 4.43 | |
| St. Paul | 5,476 | 5,043 | 433 | 7.91 | |
| Sturgeon | 5,776 | 4,782 | 994 | 17.21 | |
| Vegreville | 5,602 | 5,112 | 490 | 8.75 | |
| Vermilion | 5,472 | 4,101 | 1,371 | 25.05 | |
| Whitford | 3,786 | 2,491 | 1,295 | 34.20 | |
Calgary
There were more contestants in the race compared to 1930, but only Social Credit ran a full slate of candidates:
| Party | Candidates | MLAs elected | |||||
|---|---|---|---|---|---|---|---|
| 1935 | 1930 | ± | 1935 | 1930 | ± | ||
| Conservative | 4 | 4 | 1 | 3 | 2 | ||
| Labour | 3 | 3 | – | 1 | 1 | ||
| Liberal | 4 | 3 | 1 | 1 | 2 | 1 | |
| Social Credit | 6 | – | 6 | 4 | – | 4 | |
| Communist | 1 | 1 | – | – | – | ||
| Independent Labour | 1 | – | 1 | – | – | – | |
| Independent | 1 | 2 | 1 | – | – | – | |
| Total | 20 | 13 | 7 | 6 | 6 | ||
Eighteen counts were needed to determine the outcome, but count-by-count results are not available.[lower-alpha 1] There are only detailed results for the later counts.[4][lower-alpha 2] Manning, Irwin, Anderson, Bowlen and Gostick achieved quota, and Hugill obtained the next best result on the final count.
| Party | Candidate | Maximum round |
Maximum votes |
Share in maximum round |
Maximum votes First round votesTransfer votes | |
|---|---|---|---|---|---|---|
| Liberal | John J. Bowlen | 17 | 8,478 | 21.50% |
| |
| Social Credit | Fred Anderson | 15 | 6,638 | 16.60% |
| |
| Conservative | John Irwin | 13 | 6,092 | 15.19% |
| |
| Social Credit | Ernest Manning | 1 | 6,087 | 14.78% |
| |
| Social Credit | Edith Gostick | 18 | 5,886 | 15.56% |
| |
| Social Credit | John Hugill | 18 | 4,399 | 11.63% |
| |
| Social Credit | W. Little (not elected) | 18 | 4,002 | 10.58% |
| |
| Liberal | Robert Weir (not elected) | 16 | 3,327 | 8.32% |
| |
| Social Credit | Oscar Devenish (not elected) | 14 | 3,182 | 7.94% |
| |
| Exhausted votes | 3,366 | 8.17% |
| |||
Edmonton
The 1935 race had a broader field of candidates compared to 1930:
| Party | Candidates | MLAs elected | |||||
|---|---|---|---|---|---|---|---|
| 1935 | 1930 | ± | 1935 | 1930 | ± | ||
| Conservative | 6 | 6 | 1 | 3 | 2 | ||
| Labour | 6 | 4 | 2 | – | 1 | 1 | |
| Liberal | 6 | 4 | 2 | 3 | 1 | 2 | |
| Social Credit | 6 | – | 6 | 2 | – | 2 | |
| United Farmers | 1 | 1 | – | 1 | 1 | ||
| Communist | 1 | 1 | – | – | – | ||
| Reconstruction | 1 | – | 1 | – | – | – | |
| Independent | – | 1 | 1 | – | – | – | |
| Total | 27 | 17 | 10 | 6 | 6 | ||
As a result, the number of counts needed to select the six MLAs expanded from 14 to 23. Howson, Barnes and Van Allen won on achieving quota; Duggan, Mullen and O'Connor had the best results in the final round.
| Party | Candidate | FPv% | Count | |||||||||||||||||||||||
|---|---|---|---|---|---|---|---|---|---|---|---|---|---|---|---|---|---|---|---|---|---|---|---|---|---|---|
| 1 | 2 | 3 | 4 | 5 | 6 | 7 | 8 | 9 | 10 | 11 | 12 | 13 | 14 | 15 | 16 | 17 | 18 | 19 | 20 | 21 | 22 | 23 | ||||
| Liberal | William Howson | 24.52% | 9,139 | |||||||||||||||||||||||
| Social Credit | Samuel A. Barnes | 12.01% | 4,476 | 4,492 | 4,492 | 4,495 | 4,500 | 4,513 | 4,524 | 4,524 | 4,533 | 4,597 | 4,703 | 4,809 | 4,828 | 4,855 | 5,357 | |||||||||
| Social Credit | W. S. Hall | 7.56% | 2,818 | 2,830 | 2,830 | 2,831 | 2,832 | 2,837 | 2,841 | 2,850 | 2,856 | 2,906 | 2,985 | 3,029 | 3,040 | 3,051 | 3,223 | 3,248 | 3,373 | 3,390 | 3,468 | 3,509 | 4,542 | 4,719 | 4,721 | |
| Social Credit | David B. Mullen | 6.71% | 2,500 | 2,510 | 2,512 | 2,514 | 2,517 | 2,520 | 2,522 | 2,526 | 2,529 | 2,546 | 2,838 | 2,857 | 2,870 | 2,877 | 3,244 | 3,247 | 3,323 | 3,332 | 3,361 | 3,407 | 4,785 | 4,928 | 4,932 | |
| United Farmers | John Lymburn | 5.61% | 2,092 | 2,150 | 2,151 | 2,158 | 2,168 | 2,205 | 2,209 | 2,218 | 2,229 | 2,283 | 2,286 | 2,522 | 2,556 | 2,680 | 2,688 | 2,688 | 2,887 | 2,919 | 3,180 | 3,267 | 3,305 | |||
| Social Credit | Orvis A. Kennedy | 4.78% | 1,781 | 1,791 | 1,793 | 1,799 | 1,799 | 1,802 | 1,802 | 1,804 | 1,810 | 1,826 | 2,106 | 2,118 | 2,122 | 2,142 | 2,407 | 2,412 | 2,501 | 2,511 | 2,547 | 2,584 | ||||
| Conservative | David Duggan | 3.93% | 1,466 | 1,497 | 1,524 | 1,528 | 1,532 | 1,533 | 1,540 | 1,658 | 1,659 | 1,745 | 1,747 | 1,776 | 1,791 | 2,205 | 2,206 | 2,206 | 2,231 | 2,252 | 3,334 | 3,496 | 3,516 | 5,042 | 5,078 | |
| Liberal | George Van Allen | 3.37% | 1,255 | 2,862 | 2,866 | 2,869 | 2,874 | 2,881 | 2,886 | 2,893 | 2,899 | 2,946 | 2,946 | 2,955 | 3,336 | 3,422 | 3,434 | 3,434 | 3,579 | 4,080 | 4,224 | 4,980 | 4,996 | 5,468 | ||
| Social Credit | Mark W. Robertson | 3.34% | 1,243 | 1,248 | 1,252 | 1,252 | 1,253 | 1,257 | 1,257 | 1,259 | 1,266 | 1,272 | 1,351 | 1,366 | 1,369 | 1,372 | ||||||||||
| Liberal | Marion Conroy | 3.32% | 1,238 | 1,678 | 1,679 | 1,680 | 1,695 | 1,700 | 1,719 | 1,727 | 1,732 | 1,848 | 1,853 | 1,895 | 1,986 | 2,007 | 2,014 | 2,014 | 2,108 | 2,327 | 2,483 | |||||
| Conservative | William Atkinson | 3.27% | 1,220 | 1,242 | 1,261 | 1,265 | 1,266 | 1,273 | 1,278 | 1,351 | 1,359 | 1,398 | 1,401 | 1,454 | 1,492 | 1,950 | 1,954 | 1,954 | 2,005 | 2,025 | ||||||
| Liberal | Gerald O'Connor | 2.99% | 1,116 | 1,641 | 1,644 | 1,645 | 1,649 | 1,653 | 1,656 | 1,663 | 1,668 | 1,675 | 1,679 | 1,722 | 2,009 | 2,066 | 2,069 | 2,069 | 2,122 | 2,834 | 2,974 | 4,161 | 4,182 | 4,820 | 4,922 | |
| Communist | Jan Lakeman | 2.94% | 1,096 | 1,105 | 1,109 | 1,110 | 1,114 | 1,146 | 1,158 | 1,158 | 1,186 | 1,217 | 1,220 | 1,456 | 1,473 | 1,484 | 1,491 | 1,491 | ||||||||
| Conservative | Frederick Jamieson | 2.76% | 1,029 | 1,069 | 1,080 | 1,080 | 1,085 | 1,086 | 1,086 | 1,173 | 1,178 | 1,186 | 1,188 | 1,249 | 1,280 | |||||||||||
| Social Credit | G. L. King | 2.26% | 843 | 845 | 846 | 846 | 849 | 849 | 850 | 852 | 855 | 871 | ||||||||||||||
| Liberal | J. C. M. Marshall | 1.81% | 673 | 1,186 | 1,188 | 1,190 | 1,192 | 1,196 | 1,198 | 1,210 | 1,215 | 1,243 | 1,247 | 1,293 | 1,560 | 1,589 | 1,593 | 1,593 | 1,642 | |||||||
| Conservative | J. E. Basarab | 1.80% | 671 | 681 | 682 | 683 | 684 | 685 | 686 | 695 | 696 | |||||||||||||||
| Liberal | Walter Morrish | 1.64% | 612 | 1,078 | 1,079 | 1,083 | 1,096 | 1,100 | 1,102 | 1,112 | 1,121 | 1,157 | 1,158 | 1,211 | ||||||||||||
| Labour | James East | 1.36% | 505 | 515 | 523 | 556 | 608 | 651 | 775 | 781 | 1,125 | 1,140 | 1,141 | |||||||||||||
| Conservative | Emily Fitzsimon | 0.97% | 363 | 365 | 371 | 372 | 372 | 375 | 375 | |||||||||||||||||
| Labour | James W. Findlay | 0.89% | 331 | 337 | 350 | 376 | 408 | 431 | 462 | 464 | ||||||||||||||||
| Reconstruction | Elsie Wright | 0.52% | 192 | 196 | 200 | 201 | 205 | |||||||||||||||||||
| Labour | Carl Berg | 0.52% | 192 | 194 | 197 | 220 | 235 | 238 | ||||||||||||||||||
| Labour | Sidney Bowcott | 0.45% | 166 | 172 | 181 | 186 | ||||||||||||||||||||
| Labour | Alfred Farmilo | 0.34% | 127 | 129 | 129 | |||||||||||||||||||||
| Conservative | D. M. Ramsay | 0.19% | 71 | 72 | ||||||||||||||||||||||
| Labour | Sidney Parsons | 0.14% | 52 | 54 | ||||||||||||||||||||||
| Exhausted ballots | — | — | 4 | 4 | 4 | 10 | 12 | 17 | 25 | 27 | 87 | 94 | 231 | 231 | 243 | 263 | 263 | 848 | 949 | 1,048 | 1,215 | 1,293 | 1,642 | 1,642 | ||
| Electorate: 49,212 Valid: 37,267 Spoilt: 785 Quota: 5,324 Turnout: 38,052 (77.3%) | ||||||||||||||||||||||||||
| Party | Candidate | Maximum round |
Maximum votes |
Share in maximum round |
Maximum votes First round votesTransfer votes | |
|---|---|---|---|---|---|---|
| Liberal | William R. Howson | 1 | 9,139 | 24.52% |
| |
| Social Credit | Samuel Barnes | 15 | 5,357 | 14.48% |
| |
| Social Credit | W. S. Hall | 23 | 4,721 | 13.25% |
| |
| Social Credit | David B. Mullen | 23 | 4,932 | 13.84% |
| |
| UFA | John Lymburn | 21 | 3,305 | 9.19% |
| |
| Social Credit | Orvis A. Kennedy | 20 | 2,584 | 7.17% |
| |
| Conservative | David Duggan | 23 | 5,078 | 14.25% |
| |
| Liberal | George Van Allen | 22 | 5,468 | 15.35% |
| |
| Social Credit | Mark W. Robertson | 14 | 1,372 | 3.71% |
| |
| Liberal | Marion Conroy | 19 | 2,483 | 6.86% |
| |
| Conservative | William Atkinson | 18 | 2,025 | 5.58% |
| |
| Liberal | Gerald O'Connor | 23 | 4,922 | 13.82% |
| |
| Communist | Jan Lakeman | 16 | 1,491 | 6.52% |
| |
| Conservative | Frederick Jamieson | 13 | 1,280 | 3.46% |
| |
| Social Credit | G. L. King | 10 | 871 | 2.34% |
| |
| Liberal | J. C. M. Marshall | 17 | 1,642 | 4.51% |
| |
| Conservative | J. E. Basarab | 9 | 696 | 1.87% |
| |
| Liberal | Walter Morrish | 12 | 1,211 | 3.27% |
| |
| Labour | James East | 11 | 1,141 | 3.07% |
| |
| Conservative | Emily Fitzsimon | 7 | 375 | 1.01% |
| |
| Labour | James W. Findlay | 8 | 464 | 1.25% |
| |
| Reconstruction | Elsie Wright | 5 | 205 | 0.55% |
| |
| Labour | Carl Berg | 6 | 238 | 0.64% |
| |
| Labour | Sidney Bowcott | 4 | 186 | 0.50% |
| |
| Labour | Alfred Farmilo | 3 | 129 | 0.35% |
| |
| Conservative | D. M. Ramsay | 2 | 72 | 0.19% |
| |
| Labour | Sidney Parsons | 2 | 54 | 0.14% |
| |
| Exhausted votes | 1,642 | 4.41% |
| |||
| Transferred from | Non-transferrable | % transferred to | Total | ||||||
|---|---|---|---|---|---|---|---|---|---|
| Socred | Liberal | UFA | Conservative | Labour | Communist | Reconstruction | |||
| █ Liberal (Howson) | 4 | 55 | 3,551 | 58 | 106 | 28 | 9 | 4 | 3,815 |
| 0.10% | 1.44% | 93.08% | 1.52% | 2.78% | 0.73% | 0.24% | 0.10% | 100.00% | |
| █ Conservative (Jamieson) | 12 | 68 | 193 | 124 | 872 | – | 11 | – | 1,280 |
| 0.94% | 5.31% | 15.08% | 9.69% | 68.13% | – | 0.86% | – | 100.00% | |
| █ Social Credit (King) | 7 | 836 | 14 | 3 | 7 | 1 | 3 | – | 871 |
| 0.80% | 95.98% | 1.61% | 0.34% | 0.80% | 0.11% | 0.34% | – | 100.00% | |
| █ United Farmers (Lymburn) | 349 | 320 | 1,110 | – | 1,526 | – | – | – | 3,305 |
| 10.56% | 9.68% | 33.59% | – | 46.17% | – | – | – | 100.00% | |
| █ Communist (Lakeman) | 585 | 290 | 341 | 199 | 76 | – | – | – | 1,491 |
| 39.24% | 19.45% | 22.87% | 13.35% | 5.10% | – | – | – | 100.00% | |
Notes
- Actual figures are only available at the Provincial Archives of Alberta.[3]
- Published reports did not contain the final count for W. Little at the 18th round, but academic work suggests a value of 4,002 (ie, quota of 5,885 * 0.68),[5] which is used in the following table. Other counts are derived from the reports.
References
- Elliott, David R.; Miller, Iris (1987). Bible Bill: A Biography of William Aberhart. Edmonton: Reidmore Books. ISBN 0-919091-44-X.
- A Century of Democracy: Elections of the Legislative Assembly of Alberta, 1905-2005. Edmonton: Legislative Assembly of Alberta. pp. 116–132. ISBN 0-9689217-9-5.
- Jansen 1998, p. 260.
- "4 Social Credit, Conservative and Liberal Win Here". Calgary Herald. August 23, 1935. pp. 1, 20.
- Jansen 1998, p. 177.
- "Progress Chart of Edmonton City Balloting". Edmonton Bulletin. August 24, 1935. p. 1.
Further reading
- Jansen, Harold John (1998). The Single Transferable Vote in Aiberta and Manitoba (PDF) (PhD thesis). University of Alberta. ISBN 0-612-29051-4. Retrieved February 11, 2024.
- Bell, Edward A. (1993). Social classes and Social Credit in Alberta. McGill-Queens's University Press. ISBN 9780773564596.
- The Canadian Annual Review of Public Affairs, 1935 and 1936. Toronto: The Annual Review Company. 1939.
Party platforms
- Alberta's Provincial Liberal Leader (PDF). Liberal Party of Alberta. 1935.
- Aberhart, William (1935). Social Credit Manual: Social Credit as Applied to the Province of Alberta (PDF). Social Credit Party of Alberta. Retrieved September 28, 2021.
- Reid, R.G. (1935). Manifesto of the Alberta Government (PDF). United Farmers of Alberta. Retrieved September 28, 2021.
See also
| General elections | |
|---|---|
| By-elections |
|
| Senate nominee elections |
|
| Municipal elections |
|
| Referendums | |
See also: Elections in Canada | |