1955 Alberta general election
The 1955 Alberta general election was held on June 29, 1955, to elect members of the Legislative Assembly of Alberta.
| |||||||||||||||||||||||||||||||||||||||||||||||||||||||||||||||||||||||||||||
61 seats in the Legislative Assembly of Alberta 31 seats were needed for a majority | |||||||||||||||||||||||||||||||||||||||||||||||||||||||||||||||||||||||||||||
|---|---|---|---|---|---|---|---|---|---|---|---|---|---|---|---|---|---|---|---|---|---|---|---|---|---|---|---|---|---|---|---|---|---|---|---|---|---|---|---|---|---|---|---|---|---|---|---|---|---|---|---|---|---|---|---|---|---|---|---|---|---|---|---|---|---|---|---|---|---|---|---|---|---|---|---|---|---|
| |||||||||||||||||||||||||||||||||||||||||||||||||||||||||||||||||||||||||||||
| |||||||||||||||||||||||||||||||||||||||||||||||||||||||||||||||||||||||||||||
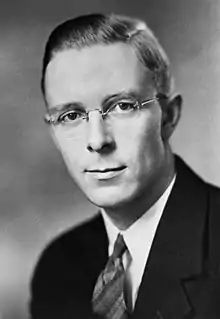
Despite losing almost 10% of the popular vote (compared to its 1952 proportion of the vote) and 30% of its seats in the legislature, the Social Credit Party, led by Ernest C. Manning, received a slightly higher number of votes than in 1952 and won a comfortable majority for its sixth term in government.
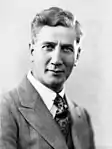
The Liberal Party emerged as the principal opposition to the Social Credit juggernaut, winning over 30% of the popular vote, and increasing its legislative caucus from 4 members to 15. The Cooperative Commonwealth Federation won two seats. However its leader, MLA Elmer Roper, was defeated, ending his thirteen-year career in the legislature. Three Conservative Party candidates and various independents also won seats.
This provincial election, like the previous seven, saw district-level proportional representation (Single transferable voting) used to elect the MLAs of Edmonton and Calgary. City-wide districts were used to elect multiple MLAs in the cities. All the other MLAs were elected in single-member districts through Instant-runoff voting. This was the last provincial election to use PR. After this the electoral system was changed to Plurality voting.
The rise in opposition MLAs was only partially created in the cities where single transferable voting was in use. Only one more opposition MLA was elected in the cities versus the number elected there in 1952. Calgary elected two Liberals in 1955 versus one in 1952. The addition of seven Liberal MLAs was produced by the rise in Liberal Party popularity. This was a sign of dis-satisfaction with the SC government which by that point in time had been in power 20 years.
A portion of the increased opposition caucus were four Liberal MLAs who were elected in rural districts through vote transfers conducted under instant-runoff voting despite the Social Credit candidate in each of the districts being the leader in the First Count. The election of these four caused the government to abandon the STV/AV system that had been in use since 1924. After the system's replacement by single-member Plurality voting and various other reforms put into effect by Premier Manning, the SC government would take many more seats in subsequent elections.[1][2]
Voter turnout in this election was 68 percent.[3]
Snap vote
The 1955 election was brought on after Liberal leader James Harper Prowse questioned the confidence of the government in question period regarding members of the Social Credit caucus who had had dealings with the Alberta Treasury Branch. Manning was angered by the question and had the Lieutenant Governor dissolve the assembly despite having two more years left in his term.
Expulsion
On the last day of the campaign Ernest Manning barred candidates Roy Lee and John Landeryou from running as official Social Credit candidates. However, due to the ballots having already been printed, the two men were still listed under the Social Credit name. Lee and Landeryou had violated the Legislative Assembly Act by renting a building to the provincial government.[4]
End of STV and AV
Following this election, the Social Credit government did away with the Alternative Vote Instant-runoff voting system, that had been in place in the rural constituencies, and the PR through Single Transferable Vote system in Edmonton and Calgary, both of which had been in place since 1924.
Under Single Transferable Voting, results would take up to five days to count the necessary vote transfers, before the last member was declared elected. This was especially problematic, in Edmonton that elected seven members. The resulting representation was very well balanced, with as many as four parties commonly elected in each major city.
As well, the government in 1955 had lost four local elections in rural constituencies due to vote transfers held under IRV, when its candidate had received the largest portion of the vote in the first round but was not elected to the seat after re-distribution of the ballots in later counts. The cancellation of the IRV system was meant to prevent this in the future. In four constituencies the SC candidate had received plurality of first-choice votes but was not elected when another candidate surpassed his lead through vote transfers conducted under IRV. This indicated to the government that the supporters of the opposition parties were beginning to support each other in a joint effort to defeat the government. (One historian has stated that there were 20 constituencies like this in which the SC at the end won only five but that number is too high. There were 16 constituencies in which, in the first count, no candidate took the majority of the votes. Only in these constituencies was it necessary to hold more counts (involving re-distribution of some votes in accordance with voters' marked back-up preferences). Even where vote transfers were conducted and more counts held, mostly the candidate leading in the first round won the seat in the end, but there were four constituencies (Acadia-Coronation, Athabasca, Lac Ste. Anne and Vermilion) in which the leading candidate in the first round was not the candidate with the most votes at the end and thus did not win the seat. The victim in all four cases was a SC candidate.)
The government presented the complicated voting procedure as reason to shift to First past the post, a voting system that was simpler but also was expected to give the government more seats. The 1955 election saw the election of the largest opposition caucus that Manning faced during his 25 years as premier (although it was just 40 percent of the seats in the Legislature). As well, it was the most opposition members Social Credit would face during its 36 years in power.
After the shift to First past the post the next election (1959) saw the government win all but four of the seats in the Legislature, far more than its due share of the vote.
Results
| Party | Leader | Candidates | First-preference votes | Seats | ||||||||
|---|---|---|---|---|---|---|---|---|---|---|---|---|
| Votes | ± | % Fpv | Change (pp) | 1952 | 1955 | ± | ||||||
| Social Credit | Ernest C. Manning | 62 | 175,553 | 7,764 | 46.42 | -9.82 | 53 | 37 / 61 |
16 | |||
| Liberal | James H. Prowse | 53 | 117,741 | 75,812 | 31.13 | 8.76 | 3 | 15 / 61 |
12 | |||
| Conservative[a 1] | John P. Page | 26 | 34,757 | 23,786 | 9.19 | 5.52 | 2 | 3 / 61 |
1 | |||
| Co-operative Commonwealth | Elmer Roper | 38 | 31,180 | 10,749 | 8.24 | -5.81 | 2 | 2 / 61 |
||||
| Independent Social Credit | 3 | 2,721 | 1,482 | 0.72 | -0.69 | 1 | 1 / 61 |
|||||
| Coalition | Frank Gainer | 2 | 4,581 | 4,581 | 1.21 | 1.21 | – | 1 / 61 |
1 | |||
| Independent | 7 | 4,225 | 3,520 | 1.12 | 0.88 | – | 1 / 61 |
1 | ||||
| Liberal–Conservative | Ross Ellis | 2 | 4,001 | 4,001 | 1.06 | 1.06 | – | 1 / 61 |
1 | |||
| Labor–Progressive | 9 | 3,420 | 2,288 | 0.90 | 0.43 | |||||||
| Total | 202 | 378,179 | 100.00% | |||||||||
| Rejected ballots | 22,839 | 2,226 | ||||||||||
| Turnout | 401,018 | 82,070 |
68.0% | 8.6 | ||||||||
| Registered voters | 589,409 | 52,239 | ||||||||||
- Compared to 1952 Conservative/PC total
MLAs elected
|
Acadia-Coronation: James Sims
Alexandra: Anders Aalborg
Athabasca: Richard Hall
Banff-Cochrane: Frank Gainer
Bonnyville: Jake Josvanger
Bow Valley-Empress: Bryce Stringam (Ind)
Bruce: Earl Hardy
Camrose: Chester Sayers
Cardston: Edgar Hinman
Clover Bar: Floyd Baker
Didsbury: James Lawrence Owens
Drumheller: Gordon Taylor
|
Edson: Norman Willmore
Gleichen: George E. Bell
Grande Prairie: Ira McLaughlin
Grouard: Joseph Desfosses
Hand Hills: Wallace Warren Cross
Lac La Biche: Michael Maccagno
Lac Ste. Anne: John Mills
Lacombe: Allen Patrick
Leduc: Ronald Ansley (I-SC)
Lethbridge: John Landeryou
Macleod: James Hartley
Medicine Hat: Elizabeth Robinson
Okotoks-High River: Ross Ellis (L-C) |
Olds: Frederick Niddrie
Pembina: Robin Jorgenson
Pincher Creek-Crowsnest: William Kovach
Ponoka: Glen Johnston
Red Deer: Cam Kirby
Redwater: Alfred Macyk
Rocky Mountain House: Alfred Hooke
St. Paul: Raymond Reierson
Sedgewick: Jack Hillman
Spirit River: Adolph Fimrite
Stettler: John Clark
Taber: Roy S. Lee
Vegreville: Stanley Ruzycki
Vermilion: Russell Whitson
Wainwright: Henry Ruste
Warner: Leonard Halmrast
Wetaskiwin: John Wingblade
Willingdon: Nick Dushenski
|
Synopsis of results
| Riding | First-preference votes | Turnout [a 1] |
Final counts | Winning party | ||||||||||||||||
|---|---|---|---|---|---|---|---|---|---|---|---|---|---|---|---|---|---|---|---|---|
| Name | SC | Lib | Con | CCF | I-SC | Coal | L-C | LPP | Ind | Total | SC | Lib | Con | CCF | I-SC | 1952 | 1955 | |||
| Acadia-Coronation | 2,026 | 1,932 | – | 607 | – | – | – | – | – | 4,565 | 83.6% | 2,122 | 2,263 | – | – | – | SC | Lib | ||
| Alexandra | 2,143 | 1,420 | 101 | 590 | – | – | – | – | – | 4,254 | 67.4% | Elected on 1st count | SC | SC | ||||||
| Athabasca | 2,073 | 2,069 | – | – | – | – | – | 293 | – | 4,435 | 71.8% | 2,097 | 2,145 | – | – | – | SC | Lib | ||
| Banff-Cochrane | 1,926 | – | – | – | – | 2,342 | – | – | – | 4,268 | 70.7% | Elected on 1st count | SC | Coal | ||||||
| Bonnyville | 1,331 | 2,250 | – | – | 788 | – | – | – | – | 4,369 | 74.3% | Elected on 1st count | SC | Lib | ||||||
| Bow Valley-Empress | 2,330 | – | – | – | – | – | – | – | 2,569 | 4,899 | 74.5% | Elected on 1st count | SC | Ind | ||||||
| Bruce | 1,978 | 1,525 | 70 | 998 | – | – | – | – | – | 4,571 | 74.2% | 2,105 | 2,033 | – | – | – | SC | SC | ||
| Camrose | 2,899 | 2,214 | 217 | 734 | – | – | – | – | – | 6,064 | 72.2% | 3,081 | 2,758 | – | – | – | SC | SC | ||
| Cardston | 1,813 | 985 | – | – | – | – | – | – | – | 2,798 | 61.8% | Elected on 1st count | SC | SC | ||||||
| Clover Bar | 2,314 | 1,609 | 331 | 603 | – | – | – | – | – | 4,857 | 70.6% | 2,505 | 2,158 | – | – | – | SC | SC | ||
| Cypress | 2,668 | 1,205 | – | – | – | – | – | – | – | 3,873 | 71.7% | Elected on 1st count | SC | SC | ||||||
| Didsbury | 2,601 | – | – | – | – | 2,239 | – | – | – | 4,840 | 72.3% | Elected on 1st count | SC | SC | ||||||
| Drumheller | 3,224 | 995 | – | – | – | – | – | 183 | – | 4,402 | 67.4% | Elected on 1st count | SC | SC | ||||||
| Edson | 2,529 | 2,146 | 192 | – | – | – | – | – | – | 4,867 | 70.7% | Elected on 1st count | SC | SC | ||||||
| Gleichen | 1,912 | 1,784 | – | – | – | – | – | – | – | 3,696 | 74.6% | Elected on 1st count | SC | SC | ||||||
| Grande Prairie | 3,240 | 1,481 | 377 | 538 | – | – | – | – | – | 5,636 | 70.8% | Elected on 1st count | SC | SC | ||||||
| Grouard | 2,319 | 2,855 | – | 571 | – | – | – | – | – | 5,745 | 67.5% | 2,425 | 3,026 | – | – | – | Lib | Lib | ||
| Hand Hills | 2,685 | 1,666 | – | – | – | – | – | – | 282 | 4,633 | 81.7% | Elected on 1st count | SC | SC | ||||||
| Lac La Biche | 1,868 | 1,931 | – | – | – | – | – | – | – | 3,799 | 74.0% | Elected on 1st count | SC | Lib | ||||||
| Lac Ste. Anne | 1,965 | 1,684 | – | 1,374 | – | – | – | – | – | 5,023 | 76.6% | 2,120 | 2,592 | – | – | – | SC | Lib | ||
| Lacombe | 2,255 | – | 1,579 | 602 | – | – | – | – | – | 4,436 | 72.5% | Elected on 1st count | SC | SC | ||||||
| Leduc | 950 | 963 | 394 | 1,147 | 1,338 | – | – | – | – | 4,792 | 68.2% | – | 1,871 | – | – | 2,035 | I-SC | I-SC | ||
| Lethbridge | 4,788 | 3,361 | 883 | 490 | – | – | – | – | – | 9,522 | 63.6% | Elected on 1st count | SC | SC | ||||||
| Little Bow | 2,481 | 1,359 | 510 | – | – | – | – | – | – | 4,350 | 75.2% | Elected on 1st count | SC | SC | ||||||
| Macleod | 3,037 | 1,946 | – | – | – | – | – | – | – | 4,983 | 66.3% | Elected on 1st count | SC | SC | ||||||
| Medicine Hat | 5,066 | 1,862 | – | 605 | – | – | – | – | – | 7,533 | 61.7% | Elected on 1st count | SC | SC | ||||||
| Okotoks-High River | 2,482 | – | – | – | – | – | 2,607 | – | – | 5,089 | 77.3% | Elected on 1st count | SC | L-C | ||||||
| Olds | 3,161 | 2,238 | – | – | – | – | – | – | – | 5,399 | 74.7% | Elected on 1st count | SC | SC | ||||||
| Peace River | 3,456 | 2,184 | – | 780 | – | – | – | – | – | 6,420 | 63.2% | Elected on 1st count | SC | SC | ||||||
| Pembina | 2,609 | 1,708 | – | 840 | – | – | – | – | – | 5,157 | 72.9% | Elected on 1st count | SC | SC | ||||||
| Pincher Creek-Crowsnest | 2,799 | – | – | – | – | – | 1,394 | 363 | – | 4,556 | 73.2% | Elected on 1st count | SC | SC | ||||||
| Ponoka | 2,254 | 1,323 | 184 | 698 | – | – | – | – | 130 | 4,589 | 71.3% | 2,320 | 1,417 | – | 751 | – | SC | SC | ||
| Red Deer | 4,170 | – | 4,381 | 637 | – | – | – | – | – | 9,188 | 70.2% | 4,286 | – | 4,786 | – | – | SC | Con | ||
| Redwater | 1,632 | 1,878 | – | 552 | – | – | – | 270 | – | 4,332 | 72.5% | 1,739 | 2,214 | – | – | – | SC | Lib | ||
| Rocky Mountain House | 2,829 | 1,200 | – | 417 | – | – | – | – | – | 4,446 | 68.6% | Elected on 1st count | SC | SC | ||||||
| St. Albert | 2,509 | 2,618 | 159 | – | – | – | – | – | 646 | 5,932 | 79.6% | 2,610 | 3,029 | – | – | – | SC | Lib | ||
| St. Paul | 2,761 | 2,049 | – | – | – | – | – | 415 | – | 5,225 | 76.4% | Elected on 1st count | SC | SC | ||||||
| Sedgewick | 2,748 | 1,450 | – | 483 | – | – | – | – | – | 4,681 | 71.7% | Elected on 1st count | SC | SC | ||||||
| Spirit River | 2,369 | 1,306 | – | 950 | – | – | – | – | – | 4,625 | 73.1% | Elected on 1st count | SC | SC | ||||||
| Stettler | 2,892 | – | 1,523 | 726 | – | – | – | – | – | 5,141 | 74.6% | Elected on 1st count | SC | SC | ||||||
| Stony Plain | 1,788 | 2,865 | – | 758 | – | – | – | – | – | 5,411 | 71.4% | Elected on 1st count | SC | Lib | ||||||
| Taber | 2,788 | 1,186 | – | – | 595 | – | – | – | – | 4,569 | 68.0% | Elected on 1st count | SC | SC | ||||||
| Vegreville | 1,887 | 1,126 | – | 1,953 | – | – | – | – | – | 4,966 | 81.0% | 2,197 | – | – | 2,374 | – | SC | CCF | ||
| Vermilion | 2,018 | 1,728 | – | 684 | – | – | – | 307 | – | 4,737 | 75.4% | 2,111 | 2,131 | – | – | – | SC | Lib | ||
| Wainwright | 2,657 | 1,537 | – | 570 | – | – | – | 63 | – | 4,827 | 72.0% | Elected on 1st count | SC | SC | ||||||
| Warner | 1,917 | 1,178 | – | – | – | – | – | – | – | 3,095 | 55.8% | Elected on 1st count | SC | SC | ||||||
| Wetaskiwin | 2,695 | 1,636 | 258 | 892 | – | – | – | – | – | 5,481 | 72.3% | 2,756 | 1,731 | – | 942 | – | SC | SC | ||
| Willingdon | 1,580 | 756 | – | 1,729 | – | – | – | – | – | 4,065 | 75.5% | 1,701 | – | – | 2,108 | – | CCF | CCF | ||
- including spoilt ballots
- = Open seat
- = turnout is above provincial average
- = Candidate was in previous Legislature
- = Incumbent had switched allegiance
- = Previously incumbent in another riding
- = Not incumbent; was previously elected to the Legislature
- = Incumbency arose from by-election gain
- = previously an MP in the House of Commons of Canada
- = Multiple candidates
STV analysis
Exhausted votes
Eighteen districts went beyond first-preference counts in order to determine winning candidates:
| District | Counts | Exhausted | |||
|---|---|---|---|---|---|
| 1st preference | Final | Votes | % of 1st pref | ||
| Calgary | 62,494 | 59,366 | 3,128 | 5.01 | |
| Edmonton | 76,544 | 74,367 | 2,177 | 2.84 | |
| Acadia-Coronation | 4,565 | 4,385 | 180 | 3.94 | |
| Athabasca | 4,435 | 4,242 | 193 | 4.35 | |
| Bruce | 4,571 | 4,138 | 433 | 9.47 | |
| Camrose | 6,064 | 5,839 | 225 | 3.71 | |
| Clover Bar | 4,857 | 4,663 | 194 | 3.99 | |
| Grouard | 5,745 | 5,461 | 284 | 4.94 | |
| Lac Ste. Anne | 5,023 | 4,712 | 311 | 6.19 | |
| Leduc | 4,792 | 3,906 | 886 | 18.49 | |
| Ponoka | 4,589 | 4,488 | 101 | 2.20 | |
| Red Deer | 9,188 | 9,072 | 116 | 1.26 | |
| Redwater | 4,332 | 3,953 | 379 | 8.75 | |
| St. Albert | 5,932 | 5,639 | 293 | 4.94 | |
| Vegreville | 4,966 | 4,571 | 395 | 7.95 | |
| Vermilion | 4,737 | 4,242 | 495 | 10.45 | |
| Wetaskiwin | 5,481 | 5,429 | 52 | 0.95 | |
| Willingdon | 4,065 | 3,809 | 256 | 6.30 | |
Calgary
Social Credit fielded more candidates than available seats. Liberals had a full slate, while the Conservatives and CCF, focusing on potential votes only, chose to have fewer candidates.
| Party | Candidates | MLAs elected | |||||
|---|---|---|---|---|---|---|---|
| 1955 | 1952 | ± | 1955 | 1952 | ± | ||
| Social Credit | 7 | 6 | 1 | 3 | 4 | 1 | |
| Liberal | 6 | 6 | 2 | 1 | 1 | ||
| Conservative | 4 | 5 | 1 | 1 | 1 | ||
| Co-operative Commonwealth | 4 | 6 | 2 | – | – | ||
| Labor–Progressive | 1 | – | 1 | – | – | – | |
| Independent | 1 | – | 1 | – | – | – | |
| Labour | – | 1 | 1 | – | – | – | |
| Independent Labour | – | 1 | 1 | – | – | – | |
| Total | 23 | 25 | 2 | 6 | 5 | 1 | |
Reports of count-by-count results are incomplete, skipping rounds 10, 11 and 13–17.[6][7] The following includes only the winning candidates plus those others going beyond the 17th round:
| Party | Candidate | Maximum round |
Maximum votes |
Share in maximum round |
Maximum votes First round votesTransfer votes | |
|---|---|---|---|---|---|---|
| PC | Arthur Ryan Smith | 1 | 9,726 | 15.59% |
| |
| Liberal | Hugh John MacDonald | 12 | 9,298 | 15.02% |
| |
| Social Credit | Frederick C. Colborne | 19 | 9,602 | 16.17% |
| |
| PC | Paul Brecken | 21 | 7,618 | 12.83% |
| |
| Social Credit | Rose Wilkinson | 20 | 8,979 | 15.12% |
| |
| Social Credit | Arthur J. Dixon | 21 | 7,698 | 12.97% |
| |
| Social Credit | Howard B. Macdonald | 18 | 5,668 | 9.48% |
| |
| Liberal | Grant MacEwan | 21 | 8,338 | 14.05% |
| |
| Exhausted votes | 3,128 | 5.01% |
| |||
Edmonton
All major parties ran full slates. There were also two Labour candidates
| Party | Candidates | MLAs elected | |||||
|---|---|---|---|---|---|---|---|
| 1952 | 1948 | ± | 1952 | 1948 | ± | ||
| Social Credit | 7 | 7 | 3 | 3 | |||
| Liberal | 7 | 7 | 3 | 2 | 1 | ||
| Conservative | 7 | 7 | 1 | 1 | |||
| Co-operative Commonwealth | 7 | 7 | – | 1 | 1 | ||
| Labor–Progressive | 1 | 1 | – | – | – | ||
| Independent | 1 | – | 1 | – | – | – | |
| Total | 30 | 29 | 1 | 7 | 7 | ||
| Party | Candidate | FPv% | Count | |||||||||||||||||||||||||||
|---|---|---|---|---|---|---|---|---|---|---|---|---|---|---|---|---|---|---|---|---|---|---|---|---|---|---|---|---|---|---|
| 1 | 2 | 3 | 4 | 5 | 6 | 7 | 8 | 9 | 10 | 11 | 12 | 13 | 14 | 15 | 16 | 17 | 18 | 19 | 20 | 21 | 22 | 23 | 24 | 25 | 26 | 27 | ||||
| Social Credit | Ernest Manning | 30.33% | 23,216 | |||||||||||||||||||||||||||
| Liberal | James Harper Prowse | 24.50% | 18,755 | 18,755 | ||||||||||||||||||||||||||
| Co-operative Commonwealth | Elmer Roper | 5.81% | 4,444 | 4,628 | 4,985 | 5,018 | 5,048 | 5,052 | 5,119 | 5,127 | 5,208 | 5,221 | 5,378 | 5,398 | 5,836 | 5,850 | 6,145 | 6,161 | 6,171 | 7,460 | 7,468 | 7,530 | 7,611 | 7,635 | 7,708 | 7,856 | 8,097 | 8,125 | 8,263 | |
| Conservative | John Percy Page | 5.34% | 4,086 | 4,446 | 4,998 | 5,015 | 5,017 | 5,050 | 5,056 | 5,136 | 5,142 | 5,429 | 5,446 | 5,561 | 5,575 | 5,731 | 5,753 | 5,791 | 5,806 | 5,833 | 5,863 | 7,352 | 7,465 | 7,523 | 7,743 | 7,888 | 8,565 | 8,676 | 9,224 | |
| Liberal | Edgar Bailey | 3.88% | 2,971 | 3,136 | 4,724 | 4,732 | 4,735 | 4,751 | 4,761 | 4,781 | 4,784 | 4,796 | 4,805 | 4,820 | 4,825 | 4,859 | 4,869 | 5,021 | 5,026 | 5,068 | 5,079 | 5,125 | 5,368 | 5,398 | 6,369 | 6,446 | ||||
| Liberal | Andre Dechene | 3.76% | 2,877 | 2,937 | 3,696 | 3,696 | 3,696 | 3,707 | 3,708 | 3,709 | 3,713 | 3,716 | 3,741 | 3,746 | 3,750 | 3,978 | 3,990 | 4,168 | 4,174 | 4,190 | 4,194 | 4,228 | 4,922 | 4,985 | ||||||
| Liberal | Abe William Miller | 3.64% | 2,787 | 2,976 | 4,634 | 4,642 | 4,642 | 4,647 | 4,650 | 4,659 | 4,665 | 4,692 | 4,701 | 4,724 | 4,741 | 4,788 | 4,807 | 5,107 | 5,118 | 5,140 | 5,155 | 5,323 | 6,185 | 6,242 | 7,998 | 8,199 | 10,674 | |||
| Social Credit | Anthony Hlynka | 2.48% | 1,896 | 3,289 | 3,311 | 3,313 | 3,314 | 3,314 | 3,317 | 3,320 | 3,324 | 3,326 | 3,330 | 3,337 | 3,343 | 3,350 | 3,381 | 3,390 | 3,455 | 3,466 | 3,686 | 3,706 | 3,728 | 5,295 | 5,503 | |||||
| Liberal | J. Laurier Payment | 2.14% | 1,640 | 1,700 | 2,843 | 2,859 | 2,859 | 2,861 | 2,863 | 2,866 | 2,869 | 2,880 | 2,883 | 2,892 | 2,898 | 2,962 | 2,976 | 3,062 | 3,067 | 3,087 | 3,094 | 3,124 | ||||||||
| Liberal | Harold Tanner | 2.10% | 1,604 | 1,677 | 4,144 | 4,161 | 4,164 | 4,171 | 4,175 | 4,211 | 4,215 | 4,231 | 4,243 | 4,247 | 4,250 | 4,286 | 4,306 | 4,430 | 4,437 | 4,448 | 4,455 | 4,522 | 5,464 | 5,490 | 6,746 | 6,891 | 9,496 | 10,445 | ||
| Social Credit | Joseph Donovan Ross | 2.06% | 1,575 | 5,632 | 5,662 | 5,672 | 5,673 | 5,674 | 5,678 | 5,690 | 5,695 | 5,705 | 5,711 | 5,722 | 5,733 | 5,744 | 5,746 | 5,752 | 5,944 | 5,951 | 6,195 | 6,236 | 6,275 | 7,078 | 7,166 | 9,319 | 9,437 | 9,447 | 9,483 | |
| Social Credit | Edgar Gerhart | 1.72% | 1,320 | 5,179 | 5,192 | 5,193 | 5,194 | 5,197 | 5,201 | 5,203 | 5,213 | 5,218 | 5,225 | 5,231 | 5,231 | 5,249 | 5,259 | 5,268 | 5,510 | 5,522 | 5,884 | 5,908 | 5,927 | 6,717 | 6,887 | 8,973 | 9,099 | 9,106 | 9,121 | |
| Conservative | Gifford Main | 1.39% | 1,064 | 1,137 | 1,203 | 1,204 | 1,204 | 1,227 | 1,228 | 1,252 | 1,255 | 1,317 | 1,321 | 1,682 | 1,709 | 1,975 | 1,992 | 2,014 | 2,021 | 2,037 | 2,052 | |||||||||
| Labor–Progressive | William Harasym | 1.24% | 947 | 956 | 960 | 962 | 963 | 965 | 965 | 966 | 969 | 971 | 977 | 979 | 983 | 986 | ||||||||||||||
| Co-operative Commonwealth | Robert Atkin | 1.23% | 940 | 956 | 965 | 965 | 983 | 984 | 1,146 | 1,148 | 1,212 | 1,213 | 1,318 | 1,319 | 1,455 | 1,466 | 1,608 | 1,617 | 1,618 | |||||||||||
| Social Credit | William J.M. Henning | 1.03% | 785 | 2,246 | 2,253 | 2,257 | 2,258 | 2,258 | 2,258 | 2,262 | 2,264 | 2,266 | 2,268 | 2,272 | 2,278 | 2,285 | 2,290 | 2,294 | 2,494 | 2,502 | 3,483 | 3,502 | 3,519 | |||||||
| Conservative | Gerard Amerongen | 0.90% | 692 | 726 | 759 | 760 | 763 | 785 | 791 | 879 | 879 | 890 | 893 | 933 | 937 | |||||||||||||||
| Social Credit | Cyril G. Havard | 0.79% | 602 | 1,346 | 1,349 | 1,352 | 1,353 | 1,354 | 1,354 | 1,355 | 1,356 | 1,361 | 1,362 | 1,365 | 1,367 | 1,369 | 1,378 | 1,386 | 1,941 | 1,946 | ||||||||||
| Social Credit | Mrs. C.N. Hattersley | 0.73% | 555 | 1,306 | 1,306 | 1,307 | 1,308 | 1,312 | 1,314 | 1,316 | 1,318 | 1,320 | 1,326 | 1,332 | 1,332 | 1,336 | 1,354 | 1,379 | ||||||||||||
| Liberal | Lois Grant | 0.72% | 552 | 570 | 928 | 930 | 932 | 935 | 937 | 948 | 957 | 960 | 970 | 974 | 978 | 988 | 1,019 | |||||||||||||
| Conservative | Robert F. Lambert | 0.72% | 548 | 566 | 584 | 586 | 586 | 647 | 647 | 659 | 661 | 675 | 677 | |||||||||||||||||
| Co-operative Commonwealth | Floyd Johnson | 0.60% | 458 | 475 | 478 | 479 | 484 | 484 | 495 | 497 | 596 | 598 | 708 | 713 | ||||||||||||||||
| Conservative | Frederick John Mitchell | 0.53% | 405 | 449 | 476 | 482 | 483 | 491 | 491 | 502 | 502 | |||||||||||||||||||
| Co-operative Commonwealth | Mary Crawford | 0.50% | 383 | 398 | 403 | 405 | 412 | 423 | 452 | 456 | 521 | 522 | ||||||||||||||||||
| Co-operative Commonwealth | Ivor Dent | 0.43% | 328 | 333 | 336 | 338 | 364 | 365 | 390 | 394 | ||||||||||||||||||||
| Conservative | Mrs. John A. L. Smith | 0.39% | 299 | 309 | 328 | 330 | 347 | 359 | 361 | |||||||||||||||||||||
| Co-operative Commonwealth | Arthur E. Thompson | 0.38% | 290 | 298 | 301 | 301 | 356 | 356 | ||||||||||||||||||||||
| Conservative | Robert L. Brower | 0.29% | 221 | 228 | 238 | 238 | 239 | |||||||||||||||||||||||
| Co-operative Commonwealth | Hubert M. Smith | 0.23% | 177 | 181 | 188 | 189 | ||||||||||||||||||||||||
| Independent | Charles E. Payne | 0.17% | 127 | 140 | 162 | |||||||||||||||||||||||||
| Exhausted ballots | — | — | 0 | 0 | 20 | 29 | 37 | 49 | 70 | 88 | 99 | 123 | 159 | 185 | 204 | 533 | 566 | 624 | 756 | 798 | 850 | 942 | 1,043 | 1,286 | 1,834 | 2,038 | 2,038 | 2,177 | ||
| Electorate: 127,069 Valid: 76,544 Spoilt: 6,248 Quota: 9,569 Turnout: 82,792 (65.2%) | ||||||||||||||||||||||||||||||
| Party | Candidate | Maximum round |
Maximum votes |
Share in maximum round |
Maximum votes First round votesTransfer votes | |
|---|---|---|---|---|---|---|
| Social Credit | Ernest Manning | 1 | 23,216 | 30.33% |
| |
| Liberal | James Harper Prowse | 1 | 18,755 | 24.50% |
| |
| CCF | Elmer Roper | 27 | 8,263 | 11.11% |
| |
| Conservative | John Percy Page | 27 | 9,224 | 12.40% |
| |
| Liberal | Edgar Bailey | 24 | 6,446 | 8.63% |
| |
| Liberal | Andre Dechene | 22 | 4,985 | 6.60% |
| |
| Liberal | Abe William Miller | 25 | 10,674 | 14.33% |
| |
| Social Credit | Anthony Hlynka | 23 | 5,503 | 7.31% |
| |
| Liberal | J. Laurier Payment | 20 | 3,124 | 4.13% |
| |
| Liberal | Harold Tanner | 26 | 10,445 | 14.02% |
| |
| Social Credit | Joseph Donovan Ross | 27 | 9,483 | 12.75% |
| |
| Social Credit | Edgar Gerhart | 27 | 9,121 | 12.26% |
| |
| Conservative | Gifford Main | 19 | 2,052 | 2.71% |
| |
| LPP | William Harasym | 14 | 986 | 1.29% |
| |
| CCF | Robert Atkin | 17 | 1,618 | 2.13% |
| |
| Social Credit | William J.M. Henning | 21 | 3,519 | 4.65% |
| |
| Conservative | Gerard Amerongen | 13 | 937 | 1.23% |
| |
| Social Credit | Cyril G. Havard | 18 | 1,946 | 2.57% |
| |
| Social Credit | Mrs. C.N. Hattersley | 16 | 1,379 | 1.81% |
| |
| Liberal | Lois Grant | 15 | 1,019 | 1.34% |
| |
| Conservative | Robert F. Lambert | 11 | 677 | 0.89% |
| |
| CCF | Floyd Johnson | 12 | 713 | 0.93% |
| |
| Conservative | Frederick John Mitchell | 9 | 502 | 0.66% |
| |
| CCF | Mary Crawford | 10 | 522 | 0.68% |
| |
| CCF | Ivor Dent | 8 | 394 | 0.52% |
| |
| Conservative | Mrs. John A. L. Smith | 7 | 361 | 0.47% |
| |
| CCF | Arthur E. Thornton | 6 | 356 | 0.47% |
| |
| Conservative | Robert L. Brower | 5 | 239 | 0.31% |
| |
| CCF | Hubert M. Smith | 4 | 189 | 0.25% |
| |
| Independent | Charles E. Payne | 3 | 162 | 0.21% |
| |
| Exhausted votes | 2,177 | 2.84% |
| |||
See also
References
- Hesketh, Bob (1987). "The Abolition of Preferential voting in Alberta". Prairie Forum. 12 (1): 123–144. ISSN 0317-6282.
- A Report on Alberta Elections, p. 77-80
- A Report on Alberta Elections, p. 81
- "Manning Takes Belated Kick At Two Former S.C. Members". Calgary Herald. June 29, 1955. p. 1.
- A Century of Democracy: Elections of the Legislative Assembly of Alberta, 1905-2005. Edmonton: Legislative Assembly of Alberta. pp. 194–207. ISBN 0-9689217-9-5.
- "A.R. Smith Tops Calgary Voting". Calgary Herald. June 30, 1955. pp. 1, 10.
- "Brecken Out On Last Count". Calgary Herald. July 2, 1955. pp. 1–2.
- "How Edmonton Chose M.L.A.s By Numerical Vote". Edmonton Journal. July 2, 1955. p. 2.
| General elections | |
|---|---|
| By-elections |
|
| Senate nominee elections |
|
| Municipal elections |
|
| Referendums | |
See also: Elections in Canada | |