1952 Alberta general election
The 1952 Alberta general election was held on August 5, 1952, to elect members of the Legislative Assembly of Alberta.
| |||||||||||||||||||||||||||||||||||||||||||||||||||||||||||||||||||||||||||||
61 seats in the Legislative Assembly of Alberta 31 seats were needed for a majority | |||||||||||||||||||||||||||||||||||||||||||||||||||||||||||||||||||||||||||||
|---|---|---|---|---|---|---|---|---|---|---|---|---|---|---|---|---|---|---|---|---|---|---|---|---|---|---|---|---|---|---|---|---|---|---|---|---|---|---|---|---|---|---|---|---|---|---|---|---|---|---|---|---|---|---|---|---|---|---|---|---|---|---|---|---|---|---|---|---|---|---|---|---|---|---|---|---|---|
| |||||||||||||||||||||||||||||||||||||||||||||||||||||||||||||||||||||||||||||
| |||||||||||||||||||||||||||||||||||||||||||||||||||||||||||||||||||||||||||||
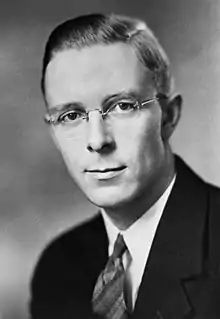
Ernest C. Manning in his third election as leader of the Social Credit Party, and its first election since the Social Credit Party paid off Alberta's first debt in 1949, led it to its fifth consecutive election victory, increasing its share of the popular vote, and winning fifty two of the sixty one seats in the legislature.
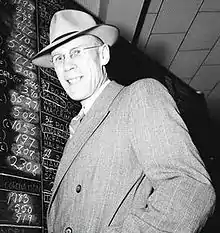
The Liberal Party formed the official opposition with only four seats. The Conservative Party returned to Alberta politics again, nominating candidates both under the "Conservative" banner, and under the "Progressive Conservative" banner recently adopted by its federal counterpart. The party won two seats, one under each banner. The Cooperative Commonwealth Federation won two seats, one that of leader Elmer Roper. The remaining seat was won by an Independent.
This provincial election, like the previous six, saw district-level proportional representation (Single transferable voting) used to elect the MLAs of Edmonton and Calgary. City-wide districts were used to elect multiple MLAs in the cities. All the other MLAs were elected in single-member districts through Instant-runoff voting.
Voter turn-out was 59.4 percent in this election.[1]
Electoral redistribution
An Act was passed in 1950 that provided for the increase in the number of MLAs from 57 to 61, upon the next election.[2] Calgary now returned six MLAs and Edmonton seven (instead of the five each previously had), and the following other changes were made:
| Abolished | New |
|---|---|
| New districts | |
| |
| Renaming of districts | |
|
|
- from part of St. Paul
- also receiving part of Athabasca
Results
| Party | Leader | Candidates | First-preference votes | Seats | ||||||||
|---|---|---|---|---|---|---|---|---|---|---|---|---|
| Votes | ± | % Fpv | Change (pp) | 1944 | 1948 | ± | ||||||
| Social Credit | Ernest C. Manning | 61 | 167,789 | 3,786 | 56.24 | 0.61 | 51 | 53 / 61 |
2 | |||
| Liberal | James H. Prowse | 55 | 66,738 | 14,083 | 22.37 | 4.51 | 2 | 3 / 61 |
1 | |||
| Co-operative Commonwealth | Elmer Roper | 41 | 41,929 | 14,458 | 14.05 | -5.08 | 2 | 2 / 61 |
||||
| Conservative | 5 | 6,271 | 6,271 | 2.10 | 2.10 | – | 1 / 61 |
1 | ||||
| Progressive Conservative | 7 | 4,700 | 4,700 | 1.57 | 1.57 | – | 1 / 61 |
1 | ||||
| Independent Social Credit | 6 | 4,203 | 1,245 | 1.41 | 0.41 | 1 | 1 / 61 |
|||||
| Independent Citizen's Association | Did not campaign[a 1] | -4.40 | 1 | 0 / 61 |
1 | |||||||
| Independent Labour | 1 | 2,927 | 2,071 | 0.98 | 0.68 | |||||||
| Labor–Progressive | 2 | 1,132 | 240 | 0.47 | -3.67 | |||||||
| Independent | 1 | 705 | 705 | 0.24 | 0.24 | |||||||
| Farmer | 1 | 655 | 655 | 0.22 | 0.22 | |||||||
| Labour | 1 | 527 | 3,052 | 0.18 | -1.03 | |||||||
| Independent Farmer | 1 | 463 | 463 | 0.16 | 0.16 | |||||||
| People's candidate | 1 | 296 | 296 | 0.10 | 0.10 | |||||||
| Total | 183 | 298,335 | 100.00% | |||||||||
| Rejected ballots | 20,613 | 2,906 | ||||||||||
| Turnout | 318,948 | 6,448 |
59.4% | 4.1 | ||||||||
| Registered voters | 537,170 | 47,859 | ||||||||||
- John P. Page campaigned and won re-election as a Conservative.
MLAs elected
|
Acadia-Coronation: Clarence Gerhart
Alexandra: Anders Aalborg
Athabasca: Antonio Aloisio
Banff-Cochrane: Lee Leavitt
Bonnyville: Laudas Joly
Bow Valley-Empress: Wilson Cain
Bruce: Earl Hardy
Camrose: Chester Sayers
Cardston: Edgar Hinman
Clover Bar: Floyd Baker
Cypress: James Underdahl
Didsbury: Howard Hammell
Drumheller: Gordon Taylor
|
Edson: Norman Willmore
Gleichen: George E. Bell
Grande Prairie: Ira McLaughlin
Grouard: Joseph Desfosses
Hand Hills: Wallace Warren Cross
Lac La Biche: Harry Lobay
Lac Ste. Anne: Angelo Montemurro
Lacombe: Allen Patrick
Leduc: Ronald Ansley (I-SC)
Lethbridge: John Landeryou
Macleod: James Hartley
Medicine Hat: John Lyle Robinson
Okotoks-High River: Ivan Casey |
Olds: Frederick Niddrie
Pembina: Robin Jorgenson
Pincher Creek-Crowsnest: William Kovach
Ponoka: Glen Johnston
Red Deer: David Ure
Redwater: Peter Chaba
Rocky Mountain House: Alfred Hooke
St. Paul: Raymond Reierson
Sedgewick: Jack Hillman
Spirit River: Adolph Fimrite
Stettler: John Clark
Taber: Roy S. Lee
Vegreville: Michael Ponich
Vermilion: William Cornish
Wainwright: William Masson
Warner: Leonard Halmrast
Wetaskiwin: John Wingblade
Willingdon: Nick Dushenski
|
Synopsis of results
| Riding | First-preference votes[a 1] | Turnout [a 2] |
Final counts | Winning party | ||||||||||||
|---|---|---|---|---|---|---|---|---|---|---|---|---|---|---|---|---|
| Name | SC | CCF | Lib | I-SC | Oth | Total | SC | CCF | Lib | I-SC | Farm | 1948 | 1952 | |||
| Acadia-Coronation | Acclamation | SC | SC | |||||||||||||
| Alexandra | 2,412 | 1,071 | – | – | – | 3,483 | 58.2% | Elected on 1st count | SC | SC | ||||||
| Athabasca | 2,012 | 623 | 864 | – | 463 | 3,962 | 66.3% | Elected on 1st count | SC | SC | ||||||
| Banff-Cochrane | 1,845 | – | 1,035 | 491 | – | 3,371 | 56.8% | Elected on 1st count | I-SC | SC | ||||||
| Bonnyville | 2,497 | – | 1,290 | – | – | 3,787 | 67.4% | Elected on 1st count | New | SC | ||||||
| Bow Valley-Empress | 2,475 | – | 1,560 | – | – | 4,035 | 67.9% | Elected on 1st count | SC | SC | ||||||
| Bruce | 2,157 | 1,210 | 756 | – | – | 4,123 | 67.9% | Elected on 1st count | SC | SC | ||||||
| Camrose | 2,919 | 1,132 | 1,015 | – | – | 5,066 | 65.1% | Elected on 1st count | SC | SC | ||||||
| Cardston | 2,011 | – | 630 | – | – | 2,641 | 56.0% | Elected on 1st count | SC | SC | ||||||
| Clover Bar | 2,238 | 935 | 769 | – | – | 3,942 | 66.2% | Elected on 1st count | SC | SC | ||||||
| Cypress | 2,240 | – | 1,048 | – | – | 3,288 | 61.2% | Elected on 1st count | SC | SC | ||||||
| Didsbury | 2,870 | – | 1,253 | – | – | 4,123 | 62.0% | Elected on 1st count | SC | SC | ||||||
| Drumheller | 3,458 | – | – | – | 308 | 3,766 | 62.0% | Elected on 1st count | SC | SC | ||||||
| Edson | 2,480 | – | 1,965 | – | – | 4,445 | 60.8% | Elected on 1st count | SC | SC | ||||||
| Gleichen | 2,061 | 273 | 675 | – | – | 3,009 | 61.0% | Elected on 1st count | SC | SC | ||||||
| Grande Prairie | 2,967 | 902 | 935 | – | – | 4,804 | 65.4% | Elected on 1st count | SC | SC | ||||||
| Grouard | 2,234 | 951 | 2,358 | – | – | 5,543 | 65.5% | 2,405 | – | 2,558 | – | – | SC | Lib | ||
| Hand Hills | 2,806 | – | 1,145 | – | – | 3,951 | 69.0% | Elected on 1st count | SC | SC | ||||||
| Lac La Biche | 1,832 | – | 1,792 | – | – | 3,624 | 68.5% | Elected on 1st count | SC | SC | ||||||
| Lac Ste. Anne | 1,639 | 1,520 | 1,069 | 469 | – | 4,697 | 71.9% | 2,034 | 1,878 | – | – | – | SC | SC | ||
| Lacombe | 2,446 | 975 | 757 | – | – | 4,178 | 70.3% | Elected on 1st count | SC | SC | ||||||
| Leduc | 1,207 | 1,331 | – | 2,051 | – | 4,589 | 63.7% | – | 1,422 | – | 2,406 | – | SC | I-SC | ||
| Lethbridge | 4,975 | – | 1,901 | – | – | 6,876 | 53.7% | Elected on 1st count | SC | SC | ||||||
| Little Bow | 2,668 | 411 | 1,001 | – | – | 4,080 | 71.0% | Elected on 1st count | SC | SC | ||||||
| Macleod | 3,232 | 496 | 773 | – | – | 4,501 | 83.9% | Elected on 1st count | SC | SC | ||||||
| Medicine Hat | 4,724 | – | 1,601 | – | – | 6,325 | 58.8% | Elected on 1st count | SC | SC | ||||||
| Okotoks-High River | 3,077 | – | 1,291 | – | – | 4,368 | 64.8% | Elected on 1st count | SC | SC | ||||||
| Olds | 3,064 | – | 1,611 | – | – | 4,675 | 66.6% | Elected on 1st count | SC | SC | ||||||
| Peace River | 3,352 | 1,177 | 1,214 | – | – | 5,743 | 57.8% | Elected on 1st count | SC | SC | ||||||
| Pembina | 2,818 | 941 | 1,127 | – | – | 4,886 | 69.5% | Elected on 1st count | SC | SC | ||||||
| Pincher Creek-Crowsnest | 3,207 | – | 1,008 | – | – | 4,215 | 62.4% | Elected on 1st count | SC | SC | ||||||
| Ponoka | 2,377 | 800 | 1,214 | – | – | 4,391 | 70.7% | Elected on 1st count | SC | SC | ||||||
| Red Deer | 4,907 | 1,496 | – | – | – | 6,403 | 58.8% | Elected on 1st count | SC | SC | ||||||
| Redwater | 1,677 | 1,002 | 1,268 | – | 296 | 4,243 | 68.8% | 1,833 | – | 1,644 | – | – | SC | SC | ||
| Rocky Mountain House | 2,886 | 1,165 | – | – | – | 4,051 | 56.2% | Elected on 1st count | SC | SC | ||||||
| St. Albert | 2,218 | 1,292 | 1,496 | – | – | 5,006 | 70.6% | 2,420 | – | 2,019 | – | – | SC | SC | ||
| St. Paul | 2,581 | – | 2,235 | – | – | 4,816 | 71.1% | Elected on 1st count | SC | SC | ||||||
| Sedgewick | 2,714 | 634 | 813 | – | – | 4,161 | 68.7% | Elected on 1st count | SC | SC | ||||||
| Spirit River | 1,738 | 1,222 | 861 | 550 | – | 4,371 | 66.3% | 2,041 | 1,418 | – | – | – | SC | SC | ||
| Stettler | 2,275 | 752 | 1,225 | 442 | – | 4,694 | 69.6% | 2,397 | 784 | 1,339 | – | – | SC | SC | ||
| Stony Plain | 1,991 | 1,218 | 1,062 | – | – | 4,271 | 68.7% | 2,177 | 1,530 | – | – | – | SC | SC | ||
| Taber | 2,809 | – | 717 | – | – | 3,526 | 58.0% | Elected on 1st count | SC | SC | ||||||
| Vegreville | 1,981 | 1,434 | 1,182 | – | – | 4,597 | 75.4% | 2,239 | 1,710 | – | – | – | SC | SC | ||
| Vermilion | 1,955 | 869 | 835 | – | 655 | 4,014 | 66.3% | 2,058 | – | 983 | – | 713 | SC | SC | ||
| Wainwright | 2,578 | – | 1,105 | – | 705 | 4,388 | 62.0% | Elected on 1st count | SC | SC | ||||||
| Warner | 1,904 | – | 633 | – | – | 2,537 | 49.3% | Elected on 1st count | SC | SC | ||||||
| Wetaskiwin | 2,664 | 1,029 | 1,029 | 200 | – | 4,922 | 66.7% | Elected on 1st count | SC | SC | ||||||
| Willingdon | 1,716 | 1,760 | 660 | – | – | 4,136 | 75.1% | 1,812 | 2,026 | – | – | – | SC | CCF | ||
- There were no Conservative or PC candidates outside Calgary and Edmonton.
- including spoilt ballots
- = Open seat
- = turnout is above provincial average
- = Candidate was in previous Legislature
- = Incumbent had switched allegiance
- = Previously incumbent in another riding
- = Not incumbent; was previously elected to the Legislature
- = Incumbency arose from by-election gain
- = previously an MP in the House of Commons of Canada
- = Multiple candidates
STV analysis
Exhausted votes
Thirteen districts went beyond first-preference counts in order to determine winning candidates:
| District | Counts | Exhausted | |||
|---|---|---|---|---|---|
| 1st preference | Final | Votes | % of 1st pref | ||
| Calgary | 41,673 | 40,019 | 1,654 | 3.97 | |
| Edmonton | 52,039 | 47,149 | 4,890 | 9.40 | |
| Grouard | 5,543 | 4,963 | 580 | 10.46 | |
| Lac Ste. Anne | 4,697 | 3,912 | 785 | 16.71 | |
| Leduc | 4,589 | 3,828 | 761 | 16.58 | |
| Redwater | 4,243 | 3,477 | 766 | 18.05 | |
| St. Albert | 5,006 | 4,439 | 567 | 11.33 | |
| Spirit River | 4,371 | 3,459 | 912 | 20.86 | |
| Stettler | 4,694 | 4,520 | 177 | 3.77 | |
| Stony Plain | 4,271 | 3,707 | 564 | 13.21 | |
| Vegreville | 4,597 | 3,949 | 648 | 14.10 | |
| Vermilion | 4,014 | 3,754 | 260 | 6.48 | |
| Willingdon | 4,136 | 3,838 | 298 | 7.21 | |
Calgary
All major parties other than the Progressive Conservatives fielded full slates.
| Party | Candidates | MLAs elected | |||||
|---|---|---|---|---|---|---|---|
| 1952 | 1948 | ± | 1952 | 1948 | ± | ||
| Social Credit | 6 | 5 | 1 | 4 | 2 | 2 | |
| Progressive Conservative | 5 | – | 5 | 1 | – | 1 | |
| Liberal | 6 | 5 | 1 | 1 | 1 | ||
| Co-operative Commonwealth | 6 | 5 | 1 | – | 1 | 1 | |
| Independent Citizen's Association | – | 3 | 3 | – | 1 | 1 | |
| Labour | 1 | 1 | – | – | – | ||
| Independent Labour | 1 | – | 1 | – | – | – | |
| Independent Social Credit | – | 2 | 2 | – | – | – | |
| Labor–Progressive | – | 1 | 1 | – | – | – | |
| Total | 25 | 22 | 3 | 6 | 5 | 1 | |
| Party | Candidate | FPv% | Count | ||||||||||||||||||||||
|---|---|---|---|---|---|---|---|---|---|---|---|---|---|---|---|---|---|---|---|---|---|---|---|---|---|
| 1 | 2 | 3 | 4 | 5 | 6 | 7 | 8 | 9 | 10 | 11 | 12 | 13 | 14 | 15 | 16 | 17 | 18 | 19 | 20 | 21 | 22 | ||||
| Social Credit | Rose Wilkinson | 16.31% | 6,796 | ||||||||||||||||||||||
| Social Credit | Howard B. Macdonald | 10.11% | 4,214 | 4,346 | 4,346 | 4,350 | 4,355 | 4,365 | 4,369 | 4,371 | 4,397 | 4,417 | 4,442 | 4,489 | 4,502 | 4,547 | 4,565 | 4,614 | 4,696 | 4,902 | 4,929 | 6,167 | |||
| Social Credit | Frederick C. Colborne | 9.54% | 3,974 | 4,252 | 4,252 | 4,254 | 4,258 | 4,268 | 4,276 | 4,298 | 4,318 | 4,401 | 4,420 | 4,438 | 4,449 | 4,470 | 4,492 | 4,563 | 4,607 | 6,292 | |||||
| Progressive Conservative | Paul Brecken | 7.50% | 3,126 | 3,147 | 3,151 | 3,154 | 3,160 | 3,176 | 3,179 | 3,183 | 3,184 | 3,211 | 3,351 | 3,391 | 3,886 | 4,380 | 4,454 | 4,552 | 5,607 | 5,656 | 5,657 | 5,725 | 5,730 | 6,269 | |
| Independent Labour | Donald Fraser McIntosh | 7.02% | 2,927 | 2,940 | 2,945 | 2,951 | 2,956 | 2,966 | 2,972 | 2,977 | 3,110 | 3,121 | 3,142 | 3,166 | 3,195 | 3,228 | 3,276 | 3,315 | 3,371 | 3,419 | 3,420 | 3,550 | 3,554 | ||
| Social Credit | Thomas Glen | 6.77% | 2,820 | 2,870 | 2,871 | 2,872 | 2,874 | 2,876 | 2,890 | 2,893 | 2,905 | 2,911 | 2,916 | 2,919 | 2,926 | 2,934 | 2,949 | 2,966 | 2,981 | 3,172 | 3,199 | ||||
| Liberal | Hugh John MacDonald | 6.51% | 2,711 | 2,724 | 2,724 | 2,730 | 2,771 | 2,833 | 2,834 | 2,842 | 2,867 | 2,991 | 3,030 | 3,547 | 3,580 | 3,663 | 3,675 | 4,499 | 4,619 | 4,659 | 4,661 | 4,747 | 4,750 | 5,216 | |
| Social Credit | Arthur J. Dixon | 6.42% | 2,677 | 2,759 | 2,762 | 2,763 | 2,766 | 2,776 | 2,776 | 2,779 | 2,790 | 2,816 | 2,829 | 2,837 | 2,840 | 2,846 | 2,858 | 2,874 | 2,981 | 3,312 | 3,586 | 4,954 | 5,149 | 5,966 | |
| Social Credit | Clifford Norman Clarke | 5.74% | 2,390 | 2,587 | 2,589 | 2,592 | 2,595 | 2,603 | 2,607 | 2,610 | 2,620 | 2,681 | 2,688 | 2,693 | 2,710 | 2,721 | 2,741 | 2,758 | 2,777 | ||||||
| Co-operative Commonwealth | Aylmer Liesemer | 4.78% | 1,991 | 1,993 | 2,030 | 2,136 | 2,142 | 2,142 | 2,380 | 2,498 | 2,642 | 2,651 | 2,664 | 2,670 | 2,681 | 2,695 | 3,508 | 3,528 | 3,575 | 3,600 | 3,601 | 3,693 | 3,696 | 4,706 | |
| Progressive Conservative | Philip P. C. Haigh | 2.17% | 905 | 908 | 908 | 908 | 924 | 925 | 935 | 937 | 939 | 957 | 1,083 | 1,098 | 1,176 | 1,508 | 1,523 | 1,551 | |||||||
| Liberal | Melvin E. Shannon | 2.06% | 857 | 860 | 861 | 865 | 889 | 936 | 937 | 949 | 986 | 1,072 | 1,100 | 1,226 | 1,241 | 1,266 | 1,275 | ||||||||
| Progressive Conservative | John James Zubick | 1.93% | 806 | 811 | 812 | 814 | 814 | 823 | 825 | 829 | 834 | 839 | 887 | 894 | |||||||||||
| Progressive Conservative | W. R. Irwin | 1.83% | 764 | 764 | 764 | 767 | 776 | 779 | 780 | 780 | 782 | 793 | 984 | 996 | 1,117 | ||||||||||
| Progressive Conservative | Ronald M. Helmer | 1.61% | 670 | 672 | 675 | 676 | 685 | 688 | 689 | 693 | 693 | 698 | |||||||||||||
| Co-operative Commonwealth | Robert T. Alderman | 1.52% | 633 | 637 | 715 | 735 | 735 | 741 | 798 | 1,040 | 1,084 | 1,097 | 1,103 | 1,107 | 1,140 | 1,147 | |||||||||
| Liberal | Alberta Clark | 1.35% | 563 | 580 | 581 | 582 | 598 | 660 | 662 | 664 | 667 | ||||||||||||||
| Liberal | Collier Maberly | 1.33% | 555 | 557 | 558 | 563 | 676 | 699 | 699 | 699 | 722 | 850 | 853 | ||||||||||||
| Labour | W. Longridge | 1.26% | 527 | 528 | 529 | 541 | 548 | 550 | 550 | 551 | |||||||||||||||
| Co-operative Commonwealth | George E. Ellinson | 0.91% | 378 | 378 | 396 | 409 | 410 | 410 | |||||||||||||||||
| Co-operative Commonwealth | H. J. Ryan | 0.80% | 333 | 334 | 375 | 422 | 422 | 425 | 460 | ||||||||||||||||
| Liberal | Richard Thomson | 0.75% | 313 | 315 | 315 | 317 | 325 | ||||||||||||||||||
| Liberal | J. A. Murray Green | 0.69% | 287 | 288 | 288 | 289 | |||||||||||||||||||
| Co-operative Commonwealth | Harold L. Livergant | 0.58% | 243 | 243 | 251 | ||||||||||||||||||||
| Co-operative Commonwealth | Ronald W. Stirling | 0.51% | 213 | 213 | |||||||||||||||||||||
| Exhausted ballots | — | — | 13 | 21 | 29 | 40 | 84 | 101 | 126 | 179 | 213 | 227 | 248 | 276 | 314 | 403 | 499 | 505 | 707 | 712 | 929 | 932 | 1,654 | ||
| Electorate: 91,289 Valid: 41,673 Spoilt: 1,694 Quota: 5,954 Turnout: 43,367 (47.5%) | |||||||||||||||||||||||||
| Party | Candidate | Maximum round |
Maximum votes |
Share in maximum round |
Maximum votes First round votesTransfer votes | |
|---|---|---|---|---|---|---|
| Social Credit | Rose Wilkinson | 1 | 6,796 | 16.31% |
| |
| Social Credit | Howard B. Macdonald | 20 | 6,167 | 15.14% |
| |
| Social Credit | Frederick C. Colborne | 18 | 6,292 | 15.36% |
| |
| PC | Paul Brecken | 22 | 6,269 | 15.67% |
| |
| Independent Labour | Donald Fraser McIntosh | 21 | 3,554 | 8.72% |
| |
| Social Credit | Thomas Glen | 19 | 3,199 | 7.81% |
| |
| Liberal | Hugh John MacDonald | 22 | 5,216 | 13.03% |
| |
| Social Credit | Arthur J. Dixon | 22 | 5,966 | 14.91% |
| |
| Social Credit | Clifford Norman Clarke | 17 | 2,777 | 6.75% |
| |
| CCF | Aylmer Liesemer | 22 | 4,706 | 11.76% |
| |
| PC | Philip P. C. Haigh | 16 | 1,551 | 3.77% |
| |
| Liberal | Melvin E. Shannon | 15 | 1,275 | 3.09% |
| |
| PC | John James Zubick | 12 | 894 | 2.16% |
| |
| PC | W. R. Irwin | 13 | 1,117 | 2.70% |
| |
| PC | Ronald M. Helmer | 10 | 698 | 1.68% |
| |
| CCF | Robert T. Alderman | 14 | 1,147 | 2.77% |
| |
| Liberal | Alberta Clark | 9 | 667 | 1.61% |
| |
| Liberal | Collier Maberly | 11 | 853 | 1.33% |
| |
| Labour | W. Longridge | 8 | 551 | 1.33% |
| |
| CCF | George Ellinson | 6 | 410 | 0.99% |
| |
| CCF | H. J. Ryan | 7 | 460 | 1.11% |
| |
| Liberal | Richard Thomson | 5 | 325 | 0.78% |
| |
| Liberal | J. A. Murray Green | 4 | 289 | 0.69% |
| |
| CCF | Harold L. Livergant | 3 | 251 | 0.60% |
| |
| CCF | Ronald W. Stirling | 2 | 213 | 0.51% |
| |
| Exhausted votes | 1,654 | 3.97% |
| |||
Edmonton
All major parties ran full slates. There were also two Labour candidates
| Party | Candidates | MLAs elected | |||||
|---|---|---|---|---|---|---|---|
| 1952 | 1948 | ± | 1952 | 1948 | ± | ||
| Social Credit | 7 | 5 | 2 | 3 | 3 | ||
| Liberal | 7 | 5 | 2 | 2 | 1 | 1 | |
| Co-operative Commonwealth | 7 | 5 | 2 | 1 | 1 | ||
| Conservative | 7 | – | 7 | 1 | – | 1 | |
| Labor–Progressive | 1 | – | 1 | – | – | – | |
| Independent Citizen's Association | – | 1 | 1 | – | – | – | |
| Total | 29 | 16 | 13 | 7 | 5 | 2 | |
| Party | Candidate | FPv% | Count | ||||||||||||||||||||||||||
|---|---|---|---|---|---|---|---|---|---|---|---|---|---|---|---|---|---|---|---|---|---|---|---|---|---|---|---|---|---|
| 1 | 2 | 3 | 4 | 5 | 6 | 7 | 8 | 9 | 10 | 11 | 12 | 13 | 14 | 15 | 16 | 17 | 18 | 19 | 20 | 21 | 22 | 23 | 24 | 25 | 26 | ||||
| Social Credit | Ernest Manning | 32.71% | 22,014 | ||||||||||||||||||||||||||
| Liberal | James Harper Prowse | 13.96% | 7,264 | 7,264 | |||||||||||||||||||||||||
| Co-operative Commonwealth | Elmer Roper | 12.74% | 6,632 | 6,632 | 6,632 | ||||||||||||||||||||||||
| Conservative | John Percy Page | 4.25% | 2,212 | 2,761 | 2,810 | 2,817 | 2,851 | 2,898 | 2,996 | 3,006 | 3,016 | 3,289 | 3,410 | 3,421 | 3,443 | 3,466 | 3,564 | 3,576 | 3,787 | 3,830 | 3,856 | 4,804 | 4,948 | 5,017 | 5,188 | 5,267 | 5,291 | 5,504 | |
| Social Credit | Joseph Donovan Ross | 3.38% | 1,757 | 4,967 | 4,977 | 4,977 | 4,981 | 4,988 | 4,995 | 4,997 | 5,003 | 5,028 | 5,044 | 5,058 | 5,069 | 5,085 | 5,126 | 5,139 | 5,189 | 5,499 | 5,516 | 5,711 | 5,766 | 6,205 | 6,328 | 7,126 | |||
| Social Credit | Ambrose Holowach | 2.65% | 1,381 | 2,659 | 2,660 | 2,661 | 2,662 | 2,664 | 2,667 | 2,670 | 2,671 | 2,677 | 2,681 | 2,686 | 2,691 | 2,716 | 2,730 | 2,734 | 2,748 | 3,252 | 3,278 | 3,363 | 3,695 | 4,005 | 4,110 | 4,540 | 4,745 | 4,809 | |
| Liberal | Andre Milville Dechene | 2.57% | 1,340 | 1,389 | 1,471 | 1,471 | 1,471 | 1,472 | 1,479 | 1,481 | 1,482 | 1,487 | 1,521 | 1,526 | 1,749 | 1,751 | 1,860 | 1,866 | 2,252 | 2,257 | 2,268 | 2,305 | 2,587 | 2,839 | |||||
| Liberal | Peter Lazarowich | 2.18% | 1,136 | 1,214 | 1,280 | 1,282 | 1,283 | 1,288 | 1,290 | 1,291 | 1,293 | 1,297 | 1,317 | 1,337 | 1,379 | 1,405 | 1,592 | 1,596 | 1,735 | 1,748 | 1,776 | 1,815 | |||||||
| Social Credit | Harry D. Carrigan | 2.18% | 1,135 | 1,814 | 1,818 | 1,819 | 1,821 | 1,826 | 1,832 | 1,834 | 1,838 | 1,841 | 1,850 | 1,852 | 1,935 | 1,936 | 1,949 | 1,956 | 1,986 | 2,152 | 2,158 | 2,211 | 2,230 | ||||||
| Social Credit | Stella M. Baker | 2.16% | 1,126 | 2,251 | 2,253 | 2,253 | 2,254 | 2,257 | 2,271 | 2,273 | 2,276 | 2,280 | 2,285 | 2,290 | 2,295 | 2,306 | 2,320 | 2,341 | 2,385 | 2,554 | 2,567 | 2,646 | 2,676 | 3,033 | 3,084 | ||||
| Conservative | Marshall E. Manning | 2.04% | 1,060 | 1,194 | 1,202 | 1,203 | 1,212 | 1,227 | 1,269 | 1,269 | 1,272 | 1,358 | 1,628 | 1,636 | 1,644 | 1,654 | 1,673 | 1,677 | 1,727 | 1,754 | 1,770 | ||||||||
| Liberal | Harold Tanner | 1.68% | 875 | 1,037 | 1,258 | 1,261 | 1,269 | 1,282 | 1,296 | 1,300 | 1,309 | 1,352 | 1,372 | 1,376 | 1,441 | 1,477 | 1,755 | 1,765 | 2,157 | 2,178 | 2,200 | 2,274 | 2,897 | 2,953 | 4,621 | 4,667 | 4,680 | 4,921 | |
| Social Credit | Williston Haszard | 1.60% | 834 | 1,609 | 1,610 | 1,610 | 1,612 | 1,614 | 1,616 | 1,619 | 1,619 | 1,624 | 1,629 | 1,632 | 1,638 | 1,644 | 1,659 | 1,664 | 1,679 | ||||||||||
| Labor–Progressive | Bernard Swankey | 1.58% | 824 | 831 | 833 | 833 | 835 | 845 | 845 | 847 | 866 | 871 | 872 | 881 | 881 | ||||||||||||||
| Liberal | Cora Casselman | 1.57% | 819 | 964 | 1,091 | 1,092 | 1,093 | 1,097 | 1,123 | 1,126 | 1,131 | 1,165 | 1,180 | 1,185 | 1,318 | 1,333 | 1,467 | 1,484 | |||||||||||
| Social Credit | Edgar Gerhart | 1.48% | 769 | 2,601 | 2,603 | 2,603 | 2,603 | 2,606 | 2,610 | 2,626 | 2,632 | 2,638 | 2,648 | 2,655 | 2,664 | 2,670 | 2,692 | 2,701 | 2,736 | 3,090 | 3,103 | 3,201 | 3,225 | 3,834 | 3,895 | 5,416 | 5,791 | 5,895 | |
| Co-operative Commonwealth | Robert Atkin | 1.26% | 658 | 683 | 685 | 705 | 705 | 708 | 714 | 771 | 819 | 822 | 824 | 927 | 927 | 1,044 | 1,054 | ||||||||||||
| Liberal | Laurette C. Douglas | 1.21% | 632 | 664 | 709 | 709 | 711 | 713 | 719 | 723 | 727 | 732 | 748 | 749 | |||||||||||||||
| Co-operative Commonwealth | Roy Jamha | 1.19% | 619 | 641 | 643 | 656 | 656 | 656 | 658 | 833 | 902 | 905 | 908 | 1,055 | 1,057 | 1,192 | 1,209 | 1,688 | 1,698 | 1,705 | |||||||||
| Co-operative Commonwealth | Arthur E. Thornton | 1.18% | 612 | 640 | 642 | 664 | 665 | 668 | 677 | 718 | 917 | 920 | 924 | 1,152 | 1,154 | 1,323 | 1,341 | 1,709 | 1,728 | 1,734 | 3,004 | 3,024 | 3,057 | 3,076 | 3,114 | 3,135 | 3,139 | ||
| Liberal | Duncan Innes | 1.17% | 608 | 727 | 837 | 837 | 838 | 841 | 842 | 846 | 848 | 868 | 883 | 893 | 1,007 | 1,014 | |||||||||||||
| Co-operative Commonwealth | Floyd Albin Johnson | 0.96% | 500 | 522 | 524 | 538 | 538 | 539 | 542 | 590 | 648 | 648 | 649 | ||||||||||||||||
| Conservative | Marcel Lambert | 0.83% | 432 | 480 | 484 | 484 | 490 | 508 | 586 | 587 | 587 | 609 | |||||||||||||||||
| Conservative | Frederick John Mitchell | 0.83% | 430 | 531 | 537 | 538 | 543 | 553 | 574 | 575 | 576 | ||||||||||||||||||
| Co-operative Commonwealth | Norman Finnemore | 0.79% | 413 | 427 | 428 | 439 | 439 | 440 | 440 | ||||||||||||||||||||
| Co-operative Commonwealth | Winnifred Scott | 0.74% | 383 | 410 | 414 | 444 | 446 | 448 | 453 | 496 | |||||||||||||||||||
| Conservative | Mrs. Arnold Taylor | 0.52% | 272 | 300 | 303 | 303 | 322 | 375 | |||||||||||||||||||||
| Conservative | John A. L. Smith | 0.36% | 189 | 205 | 207 | 207 | 220 | ||||||||||||||||||||||
| Conservative | Edward Sturrock | 0.20% | 105 | 117 | 118 | 118 | |||||||||||||||||||||||
| Exhausted ballots | — | — | 0 | 0 | 0 | 4 | 11 | 30 | 46 | 92 | 113 | 151 | 213 | 232 | 508 | 533 | 628 | 717 | 771 | 1,028 | 1,170 | 1,443 | 1,562 | 2,184 | 2,373 | 2,373 | 4,890 | ||
| Electorate: 108,424 Valid: 52,039 Spoilt: 5,217 Quota: 6,505 Turnout: 57,256 (52.8%) | |||||||||||||||||||||||||||||
| Party | Candidate | Maximum round |
Maximum votes |
Share in maximum round |
Maximum votes First round votesTransfer votes | |
|---|---|---|---|---|---|---|
| Social Credit | Ernest Manning | 1 | 17,022 | 32.71% |
| |
| Liberal | James Harper Prowse | 1 | 7,264 | 13.96% |
| |
| CCF | Elmer Roper | 1 | 6,632 | 12.74% |
| |
| Conservative | John Percy Page | 26 | 5,504 | 10.37% |
| |
| Social Credit | Joseph Donovan Ross | 24 | 7,126 | 14.35% |
| |
| Social Credit | Ambrose Holowach | 26 | 4,809 | 10.20% |
| |
| Liberal | Andre Milville Dechene | 22 | 2,839 | 5.62% |
| |
| Liberal | Peter Lazarowich | 20 | 1,815 | 3.57% |
| |
| Social Credit | Harry D. Carrigan | 21 | 2,230 | 4.41% |
| |
| Social Credit | Stella M. Baker | 23 | 3,084 | 6.19% |
| |
| Conservative | Marshall E. Manning | 19 | 1,770 | 3.47% |
| |
| Liberal | Harold Tanner | 26 | 4,921 | 10.44% |
| |
| Social Credit | Williston Haszard | 17 | 1,679 | 3.27% |
| |
| LPP | Bernard Swankey | 13 | 881 | 1.70% |
| |
| Liberal | Cora Casselman | 16 | 1,484 | 2.89% |
| |
| Social Credit | Edgar Gerhart | 26 | 5,895 | 12.50% |
| |
| CCF | Robert Atkin | 15 | 1,054 | 2.05% |
| |
| Liberal | Laurette C. Douglas | 12 | 749 | 1.45% |
| |
| CCF | Roy Jamha | 18 | 1,705 | 3.33% |
| |
| CCF | Arthur Thornton | 25 | 3,139 | 6.32% |
| |
| Liberal | Duncan Innes | 14 | 1,014 | 1.97% |
| |
| CCF | Floyd Albin Johnson | 11 | 649 | 1.25% |
| |
| Conservative | Marcel Lambert | 10 | 609 | 1.17% |
| |
| Conservative | Frederick John Mitchell | 9 | 576 | 1.11% |
| |
| CCF | Norman Finnemore | 7 | 440 | 0.85% |
| |
| CCF | Winnifred Scott | 8 | 496 | 0.95% |
| |
| Conservative | Mrs. Arnold Taylor | 6 | 375 | 0.72% |
| |
| Conservative | John A. L. Smith | 5 | 220 | 0.42% |
| |
| Conservative | Edward Sturrock | 4 | 118 | 0.23% |
| |
| Exhausted votes | 4,890 | 9.40% |
| |||
See also
References
- A Report on Alberta Elections, p. 75
- An Act to Amend The Legislative Assembly Act, S.A. 1950, c. 36
- A Century of Democracy: Elections of the Legislative Assembly of Alberta, 1905-2005. Edmonton: Legislative Assembly of Alberta. pp. 180–193. ISBN 0-9689217-9-5.
- "How The Surpluses Were Distributed". Calgary Albertan. August 7, 1952. p. 3.
- "20 Hours Required To Tally All Votes". Calgary Albertan. August 7, 1952. pp. 1, 3.
- "How Edmonton Chose M.L.A.s By Numerical Vote". Edmonton Journal. August 7, 1952. p. 2.
| General elections | |
|---|---|
| By-elections |
|
| Senate nominee elections |
|
| Municipal elections |
|
| Referendums | |
See also: Elections in Canada | |