1948 Alberta general election
The 1948 Alberta general election was held on August 17, 1948, to elect members of the Legislative Assembly of Alberta.
| |||||||||||||||||||||||||||||||||||||||||||||||||
57 seats in the Legislative Assembly of Alberta 29 seats were needed for a majority | |||||||||||||||||||||||||||||||||||||||||||||||||
|---|---|---|---|---|---|---|---|---|---|---|---|---|---|---|---|---|---|---|---|---|---|---|---|---|---|---|---|---|---|---|---|---|---|---|---|---|---|---|---|---|---|---|---|---|---|---|---|---|---|
| |||||||||||||||||||||||||||||||||||||||||||||||||
| |||||||||||||||||||||||||||||||||||||||||||||||||
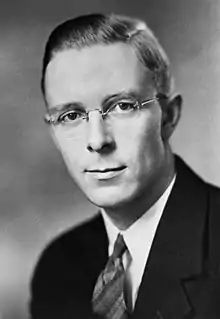
Ernest C. Manning led the Social Credit to a fourth term in government, increasing its share of the popular vote further above the 50% mark it had set in the 1944 election. It won the same number of seats — 51 of the 57 seats in the legislature — that it had won in the previous election.
The remaining seats were won by the Cooperative Commonwealth Federation, the Liberal Party and independents.
This provincial election, like the previous five, saw district-level proportional representation (Single transferable voting) used to elect the MLAs of Edmonton and Calgary. City-wide districts were used to elect multiple MLAs in the cities. All the other MLAs were elected in single-member districts through Instant-runoff voting.
Along with this election, voters got to also vote in a province wide plebiscite. The ballot asked voters about utility regulation.
Results
| Party | Leader | Candidates | First-preference votes | Seats | ||||||||
|---|---|---|---|---|---|---|---|---|---|---|---|---|
| Votes | ± | % Fpv | Change (pp) | 1944 | 1948 | ± | ||||||
| Social Credit | Ernest C. Manning | 57 | 164,003 | 17,636 | 55.63 | 5.17 | 51 | 51 / 57 |
||||
| Co-operative Commonwealth | Elmer Roper | 51 | 56,387 | 13,920 | 19.13 | -5.11 | 2 | 2 / 57 |
||||
| Liberal | James H. Prowse | 49 | 52,655 | 52,655 | 17.86 | 17.86 | – | 2 / 57 |
2 | |||
| Independent Citizen's Association[a 1] | John P. Page | 9 | 12,983 | 34,256 | 4.40 | -11.88 | 3 | 1 / 57 |
2 | |||
| Independent Social Credit | 3 | 2,958 | 2,958 | 1.00 | 1.00 | – | 1 / 57 |
1 | ||||
| Veteran's & Active Force | Did not campaign | -1.22 | 1 | 0 / 57 |
1 | |||||||
| Labour | 1 | 3,579 | 3,579 | 1.21 | 1.21 | |||||||
| Labor–Progressive | Ben Swankey | 2 | 1,372 | 10,631 | 0.47 | -3.67 | ||||||
| United Labour | 1 | 856 | 932 | 0.30 | -0.32 | |||||||
| Total | 173 | 294,793 | 100.00% | |||||||||
| Rejected ballots | 17,707 | 9,625 | ||||||||||
| Turnout | 312,500 | 14,327 |
63.5% | 7.2 | ||||||||
| Registered voters | 489,311 | 67,810 | ||||||||||
- Formerly known as the Independent Movement or the Citizens' Slate
Electrification plebiscite
The fourth plebiscite conducted province-wide in Alberta's history, it was not a traditional yes–no question, but presented two options on electricity generation and transmission, asking if the province should create "a publicly-owned utility administered by the Alberta Government Power Commission"[1] or leave the electricity industry in the hands of companies already in the business (a mixture of municipal operations and private companies). The driving force behind the referendum was whether to provide rural electrification through public ownership or leave it in the hands of private corporations that had done very little up to that time and did not have the financial resources to perform the task.[2] Despite the referendum result, the government sponsored the creation of many Rural Electrification Associations, of which some still exist today.[3]
The result shows how evenly divided the province was on the issue, with a majority of only 151 votes in favour of leaving the old system in place. In fact, voters in Edmonton were effectively split and the rural areas were in favour of provincial control, but an even larger majority in Calgary voted to retain the old system.[4]
| Option A | Option B |
|---|---|
| Are you in favour of the generation and distribution of electricity being continued by the Power Companies? | Are you in favour of the generation and distribution of electricity being made a publicly owned utility administered by the Alberta Government Power Commission? |
| District | In favour of | |||
|---|---|---|---|---|
| Status quo | Public utility | |||
| Acadia-Coronation | 1,578 | 38.81% | 2,487 | 61.19% |
| Alexandra | 1,350 | 37.00% | 2,298 | 63.00% |
| Athabasca | 1,262 | 29.08% | 3,077 | 70.92% |
| Banff-Cochrane | 2,624 | 64.31% | 1,456 | 35.69% |
| Beaver River | 2,770 | 65.85% | 1,436 | 34.15% |
| Bow Valley-Empress | 1,737 | 47.02% | 1,957 | 52.98% |
| Bruce | 1,423 | 38.01% | 2,320 | 61.99% |
| Calgary | 26,325 | 69.63% | 11,478 | 30.37% |
| Camrose | 2,164 | 42.79% | 2,893 | 57.21% |
| Cardston | 1,268 | 46.00% | 1,488 | 54.00% |
| Clover Bar | 1,722 | 38.26% | 2,778 | 61.74% |
| Cypress | 1,279 | 47.49% | 1,414 | 52.51% |
| Didsbury | 2,360 | 60.00% | 1,573 | 40.00% |
| Drumheller | 1,862 | 47.58% | 2,051 | 52.42% |
| Edmonton | 22,351 | 50.99% | 21,478 | 49.01% |
| Edson | 1,623 | 33.86% | 3,170 | 66.14% |
| Gleichen | 2,007 | 56.04% | 1,574 | 43.96% |
| Grande Prairie | 2,293 | 49.55% | 2,334 | 50.45% |
| Grouard | 1,673 | 32.21% | 3,520 | 67.79% |
| Hand Hills | 1,759 | 44.95% | 2,154 | 55.05% |
| Lac Ste. Anne | 1,242 | 28.86% | 3,061 | 71.14% |
| Lacombe | 1,994 | 43.32% | 2,608 | 56.68% |
| Leduc | 1,899 | 44.02% | 2,414 | 55.98% |
| Lethbridge | 4,237 | 64.90% | 2,291 | 35.10% |
| Little Bow | 1,653 | 52.14% | 1,517 | 47.86% |
| Macleod | 2,179 | 53.74% | 1,875 | 46.26% |
| Medicine Hat | 5,186 | 81.03% | 1,214 | 18.97% |
| Okotoks-High River | 3,321 | 61.16% | 2,109 | 38.84% |
| Olds | 2,398 | 58.60% | 1,694 | 41.40% |
| Peace River | 1,914 | 42.90% | 2,547 | 57.10% |
| Pembina | 1,710 | 34.29% | 3,276 | 65.71% |
| Pincher Creek-Crowsnest | 1,838 | 44.59% | 2,284 | 55.41% |
| Ponoka | 1,622 | 41.69% | 2,268 | 58.31% |
| Red Deer | 2,963 | 52.79% | 2,649 | 47.21% |
| Redwater | 804 | 22.66% | 2,743 | 77.31% |
| Rocky Mountain House | 2,210 | 45.63% | 2,633 | 54.37% |
| St. Albert | 1,897 | 55.16% | 2,333 | 44.84% |
| St. Paul | 1,945 | 41.50% | 2,741 | 58.50% |
| Sedgewick | 1,962 | 48.17% | 2,111 | 51.83% |
| Spirit River | 1,147 | 31.91% | 2,447 | 68.09% |
| Stettler | 2,190 | 53.91% | 1,872 | 46.09% |
| Stony Plain | 1,360 | 35.88% | 2,430 | 64.12% |
| Taber | 1,485 | 46.46% | 1,711 | 53.54% |
| Vegreville | 1,225 | 32.08% | 2,593 | 67.92% |
| Vermilion | 1,732 | 43.12% | 2,284 | 56.88% |
| Wainwright | 1,813 | 41.00% | 2,608 | 59.00% |
| Warner | 1,265 | 51.33% | 1,199 | 48.67% |
| Wetaskiwin | 2,301 | 46.23% | 2,676 | 53.77% |
| Willingdon | 1,069 | 28.24% | 2,716 | 71.76% |
| Totals | 139,991 | 50.03% | 139,840 | 49.47% |
MLAs elected
|
Acadia-Coronation: Clarence Gerhart
Alexandra: Anders Aalborg
Athabasca: Gordon Lee
Banff-Cochrane: Arthur Wray (I-SC)
Beaver River: Harry Lobay
Bow Valley-Empress: Wilson Cain
Bruce: Earl Hardy
Camrose: Chester Sayers
Clover Bar: Floyd Baker
Cypress: James Underdahl
Didsbury: Howard Hammell
Drumheller: Gordon Taylor
|
Edson: Norman Willmore
Gleichen: George E. Bell
Grande Prairie: Ira McLaughlin
Grouard: John Wood
Hand Hills: Wallace Warren Cross
Lac Ste. Anne: Albert Bourcier
Lacombe: Duncan MacMillan
Leduc: Ronald Ansley
Lethbridge: John Landeryou
Macleod: James Hartley
Medicine Hat: John Lyle Robinson
Okotoks-High River: Ivan Casey
Olds: Norman E. Cook
|
Pembina: Robin Jorgenson
Pincher Creek-Crowsnest: William Kovach
Ponoka: Ora B. Moore
Red Deer: David Ure
Redwater: Peter Chaba
Rocky Mountain House: Alfred Hooke
St. Paul: Joseph Beaudry
Sedgewick: Albert Fee
Spirit River: Henry DeBolt
Stettler: William S. Mackie
Taber: Roy S. Lee
Vegreville: Michael Ponich
Vermilion: William Cornish
Wainwright: William Masson
Warner: Leonard Halmrast
Wetaskiwin: John Wingblade
Willingdon: William Tomyn
|
Synopsis of results
| Riding | First-preference votes | Turnout [a 1] |
Final counts | Winning party | ||||||||||||
|---|---|---|---|---|---|---|---|---|---|---|---|---|---|---|---|---|
| Name | SC | CCF | Lib | ICA | Oth | Total | SC | CCF | Lib | ICA | I-SC | 1944 | 1948 | |||
| Acadia-Coronation | 2,332 | 641 | 1,254 | – | – | 4,227 | 78.5% | Elected on 1st count | SC | SC | ||||||
| Alexandra | 2,034 | 1,190 | 651 | – | – | 3,875 | 57.7% | Elected on 1st count | SC | SC | ||||||
| Athabasca | 2,374 | 1,226 | 958 | – | – | 4,558 | 59.0% | Elected on 1st count | SC | SC | ||||||
| Banff-Cochrane | 1,084 | – | – | 1,246 | 1,658 | 3,988 | 58.2% | – | – | – | 1,465 | 1,964 | SC | I-SC | ||
| Beaver River | 1,992 | 1,282 | 1,579 | – | – | 4,853 | 68.9% | 2,117 | – | 1,698 | – | – | SC | SC | ||
| Bow Valley-Empress | 2,178 | 683 | 1,063 | – | – | 3,924 | 68.9% | Elected on 1st count | SC | SC | ||||||
| Bruce | 2,248 | 1,080 | 615 | – | – | 3,943 | 64.0% | Elected on 1st count | SC | SC | ||||||
| Camrose | 3,041 | 1,315 | 1,003 | – | – | 5,359 | 71.2% | Elected on 1st count | SC | SC | ||||||
| Cardston | 1,981 | – | 944 | – | – | 2,925 | 60.00% | Elected on 1st count | SC | SC | ||||||
| Clover Bar | 2,801 | 1,035 | 761 | – | – | 4,597 | 70.1% | Elected on 1st count | SC | SC | ||||||
| Cypress | 1,723 | 410 | 844 | – | – | 2,977 | 69.2% | Elected on 1st count | SC | SC | ||||||
| Didsbury | 2,647 | 417 | – | 935 | – | 3,999 | 64.5% | Elected on 1st count | SC | SC | ||||||
| Drumheller | 2,982 | – | 271 | – | 856 | 4,109 | 76.4% | Elected on 1st count | SC | SC | ||||||
| Edson | 2,543 | 1,715 | 770 | – | – | 5,028 | 65.4% | Elected on 1st count | SC | SC | ||||||
| Gleichen | 2,354 | – | – | 1,303 | – | 3,657 | 65.4% | Elected on 1st count | SC | SC | ||||||
| Grande Prairie | 2,952 | 1,019 | 768 | – | – | 4,739 | 68.4% | Elected on 1st count | SC | SC | ||||||
| Grouard | 2,493 | 1,249 | 1,850 | – | – | 5,592 | 75.7% | 2,717 | – | 1,917 | – | – | SC | SC | ||
| Hand Hills | 2,773 | – | 1,607 | – | – | 4,380 | 78.9% | Elected on 1st count | SC | SC | ||||||
| Lac Ste. Anne | 1,899 | 1,558 | 1,023 | – | 39 | 4,519 | 69.7% | 2,401 | 1,742 | – | – | – | SC | SC | ||
| Lacombe | 3,053 | 1,109 | 643 | – | – | 4,805 | 70.8% | Elected on 1st count | SC | SC | ||||||
| Leduc | 2,548 | 1,071 | 772 | – | – | 4,391 | 61.2% | Elected on 1st count | SC | SC | ||||||
| Lethbridge | 3,829 | 1,441 | 1,768 | – | – | 7,038 | 65.0% | Elected on 1st count | SC | SC | ||||||
| Little Bow | 1,865 | 435 | – | 1,086 | – | 3,386 | 75.1% | Elected on 1st count | SC | SC | ||||||
| Macleod | 2,852 | 756 | 612 | – | – | 4,220 | 67.8% | Elected on 1st count | SC | SC | ||||||
| Medicine Hat | 3,835 | 996 | 1,043 | – | – | 5,874 | 64.0% | Elected on 1st count | SC | SC | ||||||
| Okotoks-High River | 3,876 | 490 | 1,219 | – | – | 5,585 | 62.5% | Elected on 1st count | SC | SC | ||||||
| Olds | 3,260 | 424 | 690 | – | – | 4,374 | 66.8% | Elected on 1st count | SC | SC | ||||||
| Peace River | 3,191 | 1,087 | 829 | – | – | 5,107 | 61.3% | Elected on 1st count | SC | SC | ||||||
| Pembina | 3,165 | 1,462 | 684 | – | – | 5,311 | 72.8% | Elected on 1st count | SC | SC | ||||||
| Pincher Creek-Crowsnest | 2,210 | 815 | 998 | – | 856 | 4,879 | 72.0% | 2,292 | – | 1,045 | – | – | SC | SC | ||
| Ponoka | 2,679 | 1,023 | 519 | – | – | 4,221 | 69.6% | Elected on 1st count | SC | SC | ||||||
| Red Deer | 4,771 | 1,082 | – | – | – | 5,853 | 66.0% | Elected on 1st count | SC | SC | ||||||
| Redwater | 1,807 | 1,528 | 441 | – | – | 3,776 | 66.9% | 1,912 | 1,572 | – | – | – | SC | SC | ||
| Rocky Mountain House | 3,582 | 1,365 | – | – | – | 4,947 | 63.4% | Elected on 1st count | SC | SC | ||||||
| St. Albert | 2,702 | 1,047 | 774 | – | – | 4,523 | 67.9% | Elected on 1st count | SC | SC | ||||||
| St. Paul | 2,197 | 1,510 | 1,416 | – | – | 5,123 | 73.3% | 2,980 | 1,584 | – | – | – | SC | SC | ||
| Sedgewick | 2,867 | 567 | 838 | – | – | 4,272 | 71.6% | Elected on 1st count | SC | SC | ||||||
| Spirit River | 2,155 | 1,194 | 631 | – | – | 3,980 | 68.9% | Elected on 1st count | SC | SC | ||||||
| Stettler | 3,249 | 953 | – | – | – | 4,201 | 67.8% | Elected on 1st count | SC | SC | ||||||
| Stony Plain | 2,188 | 1,037 | 872 | – | – | 4,097 | 68.9% | Elected on 1st count | SC | SC | ||||||
| Taber | 2,559 | 501 | 463 | – | – | 3,523 | 62.6% | Elected on 1st count | SC | SC | ||||||
| Vegreville | 2,101 | 1,276 | 763 | – | – | 4,140 | 70.1% | Elected on 1st count | SC | SC | ||||||
| Vermilion | 1,999 | 1,158 | 1,179 | – | – | 4,336 | 71.9% | 2,196 | – | 1,323 | – | – | SC | SC | ||
| Wainwright | 2,877 | 887 | 833 | – | – | 4,597 | 70.4% | Elected on 1st count | SC | SC | ||||||
| Warner | 1,691 | – | 598 | – | – | 2,289 | 53.6% | Elected on 1st count | SC | SC | ||||||
| Wetaskiwin | 2,827 | 1,232 | 1,414 | – | – | 5,473 | 75.8% | Elected on 1st count | SC | SC | ||||||
| Willingdon | 2,111 | 1,861 | – | – | – | 3,972 | 72.6% | Elected on 1st count | SC | SC | ||||||
- including spoilt ballots
- = Open seat
- = turnout is above provincial average
- = Candidate was in previous Legislature
- = Incumbent had switched allegiance
- = Previously incumbent in another riding
- = Not incumbent; was previously elected to the Legislature
- = Incumbency arose from by-election gain
- = previously an MP in the House of Commons of Canada
- = Multiple candidates
STV analysis
Exhausted votes
Ten districts went beyond first-preference counts in order to determine winning candidates:
| District | Counts | Exhausted | |||
|---|---|---|---|---|---|
| 1st preference | Final | Votes | % of 1st pref | ||
| Calgary | 39,309 | 36,238 | 3,071 | 5.72 | |
| Edmonton | 46,150 | 44,256 | 1,894 | 4.10 | |
| Banff-Cochrane | 3,988 | 3,429 | 559 | 14.02 | |
| Beaver River | 4,853 | 3,815 | 1,038 | 21.39 | |
| Grouard | 5,592 | 4,634 | 958 | 17.13 | |
| Lac Ste. Anne | 4,519 | 4,143 | 376 | 8.32 | |
| Pincher Creek-Crowsnest | 4,879 | 3,337 | 1,542 | 31.60 | |
| Redwater | 3,776 | 3,484 | 292 | 7.73 | |
| St. Paul | 5,123 | 4,564 | 559 | 10.91 | |
| Vermilion | 4,336 | 3,519 | 817 | 18.84 | |
Calgary
All parties other than the Independent Movement fielded full slates.
| Party | Candidates | MLAs elected | |||||
|---|---|---|---|---|---|---|---|
| 1944 | 1940 | ± | 1944 | 1940 | ± | ||
| Social Credit | 5 | 5 | 2 | 2 | |||
| Co-operative Commonwealth | 5 | 5 | 1 | 1 | |||
| Liberal | 5 | – | 5 | 1 | – | 1 | |
| Independent Citizen's Association | 3 | 4 | 1 | 1 | 2 | 1 | |
| Labor–Progressive | 1 | 5 | 4 | – | – | – | |
| Labour | 1 | – | 1 | – | – | – | |
| Independent Social Credit | 2 | – | 2 | – | – | – | |
| Total | 22 | 19 | 3 | 5 | 5 | ||
| Party | Candidate | FPv% | Count | |||||||||||||||||||
|---|---|---|---|---|---|---|---|---|---|---|---|---|---|---|---|---|---|---|---|---|---|---|
| 1 | 2 | 3 | 4 | 5 | 6 | 7 | 8 | 9 | 10 | 11 | 12 | 13 | 14 | 15 | 16 | 17 | 18 | 19 | ||||
| Social Credit | Rose Wilkinson | 18.29% | 7,153 | |||||||||||||||||||
| Social Credit | Frederick C. Colborne | 10.03% | 3,923 | 4,196 | 4,200 | 4,205 | 4,209 | 4,291 | 4,299 | 4,313 | 4,499 | 4,562 | 4,580 | 4,696 | 4,805 | 5,809 | 5,883 | 6,764 | ||||
| Independent Citizen's Association | Howard B. Macdonald | 9.82% | 3,840 | 3,847 | 3,849 | 3,849 | 3,854 | 3,884 | 4,155 | 4,162 | 4,190 | 4,238 | 4,245 | 4,300 | 5,195 | 5,205 | 5,464 | 5,490 | 5,985 | 5,988 | 6,339 | |
| Labour | Peter Morrison | 9.15% | 3,579 | 3,596 | 3,596 | 3,613 | 3,664 | 3,700 | 3,719 | 3,744 | 3,789 | 3,835 | 3,880 | 3,908 | 3,959 | 3,982 | 4,031 | 4,083 | 4,160 | 4,168 | ||
| Co-operative Commonwealth | Aylmer Liesemer | 6.33% | 2,475 | 2,479 | 2,568 | 2,726 | 2,925 | 2,944 | 2,954 | 3,339 | 3,355 | 3,368 | 4,214 | 4,227 | 4,258 | 4,270 | 4,327 | 4,343 | 4,416 | 4,417 | 5,742 | |
| Social Credit | James Leslie Hill | 6.30% | 2,464 | 2,535 | 2,537 | 2,540 | 2,543 | 2,671 | 2,677 | 2,689 | 2,809 | 2,831 | 2,842 | 2,856 | 2,886 | 3,087 | 3,128 | 4,265 | 4,351 | 4,580 | 5,535 | |
| Liberal | Hugh John MacDonald | 5.06% | 1,977 | 1,981 | 1,982 | 1,982 | 1,986 | 2,000 | 2,034 | 2,037 | 2,051 | 2,237 | 2,240 | 2,824 | 2,892 | 2,901 | 3,951 | 3,972 | 5,876 | 5,879 | 6,215 | |
| Social Credit | R.B. Estabrook | 4.48% | 1,751 | 1,830 | 1,830 | 1,831 | 1,835 | 1,885 | 1,891 | 1,909 | 1,991 | 2,004 | 2,011 | 2,013 | 2,041 | 2,241 | 2,289 | |||||
| Liberal | J. Roger Flumerfelt | 4.32% | 1,691 | 1,696 | 1,702 | 1,704 | 1,710 | 1,717 | 1,728 | 1,737 | 1,750 | 1,874 | 1,889 | 2,145 | 2,223 | 2,226 | ||||||
| Liberal | Mary Dover | 4.10% | 1,602 | 1,610 | 1,613 | 1,615 | 1,616 | 1,621 | 1,688 | 1,692 | 1,704 | 1,929 | 1,936 | 2,225 | 2,307 | 2,320 | 2,866 | 2,885 | ||||
| Liberal | Michael J. McCormick | 3.16% | 1,237 | 1,242 | 1,244 | 1,244 | 1,246 | 1,251 | 1,258 | 1,261 | 1,272 | 1,429 | 1,432 | |||||||||
| Independent Citizen's Association | M.V. Anderson | 3.15% | 1,233 | 1,242 | 1,242 | 1,246 | 1,250 | 1,272 | 1,385 | 1,390 | 1,412 | 1,444 | 1,448 | 1,461 | ||||||||
| Social Credit | George M. Whicher | 2.79% | 1,091 | 1,203 | 1,203 | 1,207 | 1,207 | 1,245 | 1,253 | 1,257 | 1,479 | 1,510 | 1,512 | 1,522 | 1,537 | |||||||
| Liberal | Loftus Dudley Ward | 2.42% | 948 | 951 | 951 | 955 | 957 | 966 | 974 | 977 | 994 | |||||||||||
| Independent Social Credit | A.P. Van Buren | 1.89% | 738 | 754 | 757 | 765 | 766 | 849 | 857 | 858 | ||||||||||||
| Independent Citizen's Association | Edwina Milvain | 1.48% | 578 | 580 | 586 | 587 | 589 | 598 | ||||||||||||||
| Independent Social Credit | Art Larsen | 1.44% | 563 | 572 | 575 | 577 | 582 | |||||||||||||||
| Co-operative Commonwealth | George Ellinson | 1.38% | 539 | 539 | 596 | 655 | 718 | 721 | 723 | |||||||||||||
| Co-operative Commonwealth | George R. Austin | 1.32% | 518 | 519 | 542 | 724 | 863 | 871 | 872 | 1,058 | 1,066 | 1,078 | ||||||||||
| Labor–Progressive | Terry Levis | 1.32% | 516 | 516 | 518 | 521 | ||||||||||||||||
| Co-operative Commonwealth | W. Orr | 1.13% | 442 | 442 | 469 | |||||||||||||||||
| Co-operative Commonwealth | Mary A. Hart | 0.62% | 243 | 243 | ||||||||||||||||||
| Exhausted ballots | — | — | 11 | 24 | 38 | 64 | 98 | 117 | 161 | 223 | 245 | 355 | 407 | 481 | 543 | 645 | 782 | 1,032 | 1,035 | 2,236 | ||
| Electorate: 76,939 Valid: 39,101 Spoilt: 2,359 Quota: 6,517 Turnout: 41,460 (53.9%) | ||||||||||||||||||||||
| Party | Candidate | Maximum round |
Maximum votes |
Share in maximum round |
Maximum votes First round votesTransfer votes | |
|---|---|---|---|---|---|---|
| Social Credit | Rose Wilkinson | 1 | 7,153 | 18.29% |
| |
| Social Credit | Frederick C. Colborne | 16 | 6,764 | 17.65% |
| |
| ICA | Howard B. Macdonald | 19 | 6,339 | 17.20% |
| |
| Independent Labour | Peter Morrison | 18 | 4,168 | 10.95% |
| |
| CCF | Aylmer Liesemer | 19 | 5,742 | 15.58% |
| |
| Social Credit | James Leslie Hill | 19 | 5,535 | 15.01% |
| |
| Liberal | Hugh John MacDonald | 19 | 6,215 | 16.86% |
| |
| Social Credit | R.B. Estabrook | 15 | 2,289 | 5.95% |
| |
| Liberal | J. Roger Flumerfelt | 14 | 2,226 | 5.77% |
| |
| Liberal | Mary Dover | 16 | 2,885 | 7.53% |
| |
| Liberal | Michael J. McCormick | 11 | 1,432 | 3.70% |
| |
| ICA | M.V. Anderson | 12 | 1,461 | 3.78% |
| |
| Social Credit | George M. Whicher | 13 | 1,537 | 3.98% |
| |
| Liberal | Loftus Dudley Ward | 9 | 994 | 2.56% |
| |
| Independent Social Credit | A.P. Van Buren | 8 | 858 | 2.20% |
| |
| ICA | Edwina Milvain | 6 | 598 | 1.53% |
| |
| Independent Social Credit | Art Larsen | 5 | 582 | 1.49% |
| |
| CCF | George Ellinson | 7 | 723 | 1.85% |
| |
| CCF | George R. Austin | 10 | 1,078 | 2.77% |
| |
| LPP | Terry Levis | 4 | 521 | 1.33% |
| |
| CCF | W. Orr | 3 | 469 | 1.20% |
| |
| CCF | Mary A. Hart | 2 | 243 | 0.62% |
| |
| Exhausted votes | 2,236 | 5.72% |
| |||
Edmonton
Three parties had full slates. The Independent Movement presented four candidates, and Williams campaigned under his own banner.
| Party | Candidates | MLAs elected | |||||
|---|---|---|---|---|---|---|---|
| 1944 | 1940 | ± | 1944 | 1940 | ± | ||
| Social Credit | 5 | 5 | 3 | 2 | 1 | ||
| Co-operative Commonwealth | 5 | 5 | 1 | 1 | |||
| Liberal | 5 | – | 5 | 1 | – | 1 | |
| Independent Citizen's Association | 1 | 4 | 3 | – | 1 | 1 | |
| Veteran's & Active Force | – | 1 | 1 | – | 1 | 1 | |
| Labor–Progressive | – | 5 | 5 | – | – | – | |
| Total | 16 | 20 | 4 | 5 | 5 | ||
| Party | Candidate | FPv% | Count | ||||||||||||||
|---|---|---|---|---|---|---|---|---|---|---|---|---|---|---|---|---|---|
| 1 | 2 | 3 | 4 | 5 | 6 | 7 | 8 | 9 | 10 | 11 | 12 | 13 | 14 | ||||
| Social Credit | Ernest Manning | 47.70% | 22,014 | ||||||||||||||
| Co-operative Commonwealth | Elmer Roper | 14.11% | 6,511 | 6,712 | 6,721 | 6,876 | 7,102 | 7,125 | 7,511 | 7,536 | 7,543 | 8,869 | |||||
| Liberal | James Harper Prowse | 13.66% | 6,303 | 7,124 | 7,191 | 7,192 | 7,199 | 7,516 | 7,534 | 8,167 | |||||||
| Independent Citizen's Association | John Percy Page | 5.90% | 2,723 | 3,913 | 3,917 | 3,925 | 3,941 | 4,068 | 4,105 | 4,148 | 4,190 | 4,226 | 4,306 | 4,353 | 4,725 | 4,883 | |
| Liberal | Peter Lazarowich | 2.67% | 1,234 | 1,371 | 1,390 | 1,395 | 1,399 | 1,518 | 1,529 | 1,702 | 2,083 | 2,115 | 2,142 | 2,167 | |||
| Co-operative Commonwealth | Jack Hampson | 2.27% | 1,046 | 1,065 | 1,066 | 1,167 | 1,245 | 1,250 | 1,544 | 1,562 | 1,567 | ||||||
| Social Credit | Clayton Adams | 2.05% | 946 | 4,881 | 4,894 | 4,895 | 4,914 | 4,938 | 4,958 | 5,026 | 5,037 | 5,047 | 5,071 | 5,769 | 5,938 | 7,559 | |
| Liberal | Mary Scullion | 2.04% | 942 | 1,039 | 1,060 | 1,060 | 1,060 | 1,122 | 1,133 | ||||||||
| Social Credit | Lou Heard | 1.93% | 890 | 4,778 | 4,785 | 4,792 | 4,797 | 4,818 | 4,828 | 4,864 | 4,875 | 4,891 | 4,910 | 5,271 | 5,479 | 7,746 | |
| Social Credit | John Gillies | 1.67% | 772 | 3,198 | 3,203 | 3,203 | 3,209 | 3,246 | 3,258 | 3,304 | 3,317 | 3,343 | 3,357 | 4,110 | 4,274 | ||
| Co-operative Commonwealth | Mary Crawford | 1.34% | 618 | 652 | 657 | 697 | 859 | 866 | |||||||||
| Liberal | Francis Ford | 1.22% | 565 | 728 | 770 | 780 | 786 | ||||||||||
| Social Credit | Walter Crockett | 1.13% | 523 | 1,870 | 1,874 | 1,879 | 1,883 | 1,905 | 1,928 | 1,948 | 1,953 | 1,968 | 1,989 | ||||
| Co-operative Commonwealth | Arthur Thornton | 1.08% | 498 | 522 | 526 | 561 | |||||||||||
| Co-operative Commonwealth | Joseph Dowler | 0.80% | 370 | 381 | 385 | ||||||||||||
| Liberal | William Brownlee | 0.42% | 195 | 224 | |||||||||||||
| Exhausted ballots | — | — | 0 | 19 | 36 | 64 | 86 | 130 | 201 | 201 | 307 | 307 | 412 | 1,666 | 1,894 | ||
| Electorate: 84,391 Valid: 46,150 Spoilt: 1,126 Quota: 7,692 Turnout: 47,276 (56.0%) | |||||||||||||||||
| Party | Candidate | Maximum round |
Maximum votes |
Share in maximum round |
Maximum votes First round votesTransfer votes | |
|---|---|---|---|---|---|---|
| Social Credit | Ernest Manning | 1 | 22,014 | 47.70% |
| |
| CCF | Elmer Roper | 10 | 8,869 | 19.35% |
| |
| Liberal | James Harper Prowse | 8 | 8,167 | 17.77% |
| |
| ICA | John Percy Page | 14 | 4,883 | 11.03% |
| |
| Liberal | Peter Lazarowich | 12 | 2,167 | 4.74% |
| |
| CCF | Jack Hampson | 9 | 1,567 | 3.41% |
| |
| Social Credit | Clayton Adams | 14 | 7,559 | 17.08% |
| |
| Liberal | Mary Scullion | 7 | 1,133 | 2.46% |
| |
| Social Credit | Lou Heard | 14 | 7,746 | 17.50% |
| |
| Social Credit | John Gillies | 13 | 4,274 | 9.61% |
| |
| CCF | Mary Crawford | 6 | 866 | 1.88% |
| |
| Liberal | Francis Ford | 5 | 786 | 1.71% |
| |
| Social Credit | Walter Crockett | 11 | 1,989 | 4.34% |
| |
| CCF | Arthur Thornton | 4 | 561 | 1.22% |
| |
| CCF | Joseph Dowler | 3 | 385 | 0.83% |
| |
| Liberal | William Brownlee | 2 | 224 | 0.49% |
| |
| Exhausted votes | 1,894 | 4.10% |
| |||
See also
References
- A Report on Alberta Elections, p. 185
- The People's Weekly, August 14, Sept. 4, 1948
- "Alberta Power Market" website, accessed May 16, 2020
- "Private Hydro Control Swung By City Votes". Calgary Albertan. August 20, 1948. p. 3.
- A Century of Democracy: Elections of the Legislative Assembly of Alberta, 1905-2005. Edmonton: Legislative Assembly of Alberta. pp. 484–485. ISBN 0-9689217-9-5.
- A Century of Democracy: Elections of the Legislative Assembly of Alberta, 1905-2005. Edmonton: Legislative Assembly of Alberta. pp. 166–178. ISBN 0-9689217-9-5.
- "2 Social Credit Elected Here". Calgary Herald. August 18, 1948. pp. 1, 10.
- "Private Power Vote 109,330". Calgary Herald. August 19, 1948. pp. 1, 2.
- "Here's How Votes Were Distributed To Elect Five Alberta MLAs Here". Edmonton Bulletin. August 19, 1948. p. 7.
| General elections | |
|---|---|
| By-elections |
|
| Senate nominee elections |
|
| Municipal elections |
|
| Referendums | |
See also: Elections in Canada | |